
Large areas of Australia saw an above average number of lightning days this summer, with Melbourne, Canberra and Brisbane all seeing 5 to 6 extra storm days during the season.
Australia always sees lots of lightning during summer as hot air, abundant moisture and ample atmospheric instability combine to create ideal conditions for thunderstorms.
The map below shows the average number of thunder days in Australia during summer, based on all lightning detected by Total Lightning Network between 2014 and 2024. Storm days are defined as any day where lightning is detected close enough to cause audible thunder.
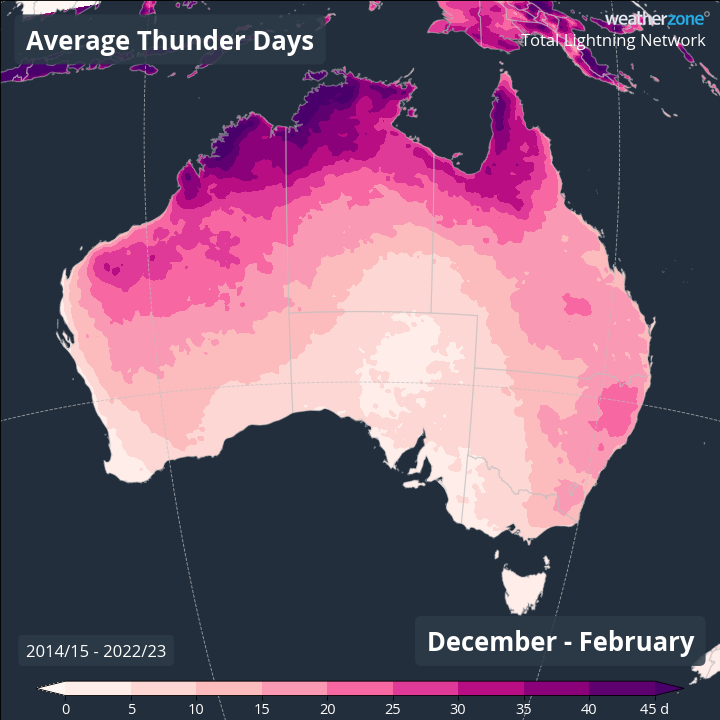
Image: Average number of thunder days in Australia during summer, based on lightning detected by Total Lightning Network (TLN) between 2014 and 2024.
In an average summer, northern and eastern Australia typically see the highest number of thunder days. There is a noticeable peak over the western Top End and Kimberley regions, with Darwin averaging around 47 thunder days per summer.
This summer saw an unusually high number of thunder days Australia’s central and eastern tropics and over most of Qld, NSW, SA, Vic, the ACT and Tas. By contrast, there were less thunder days than normal over large areas of WA and pockets of central Australia and central Qld. The maps below show the observed thunder days this summer and the correlating anomalies for the season.
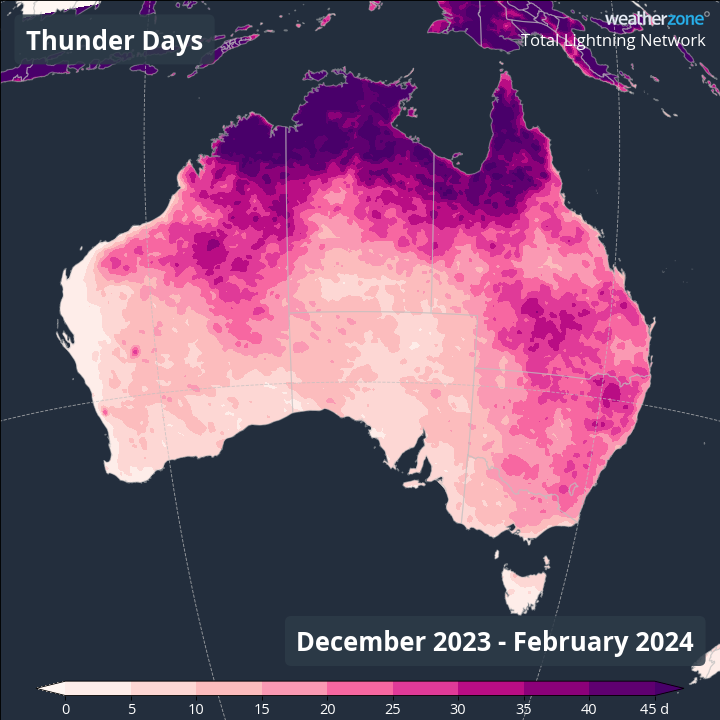
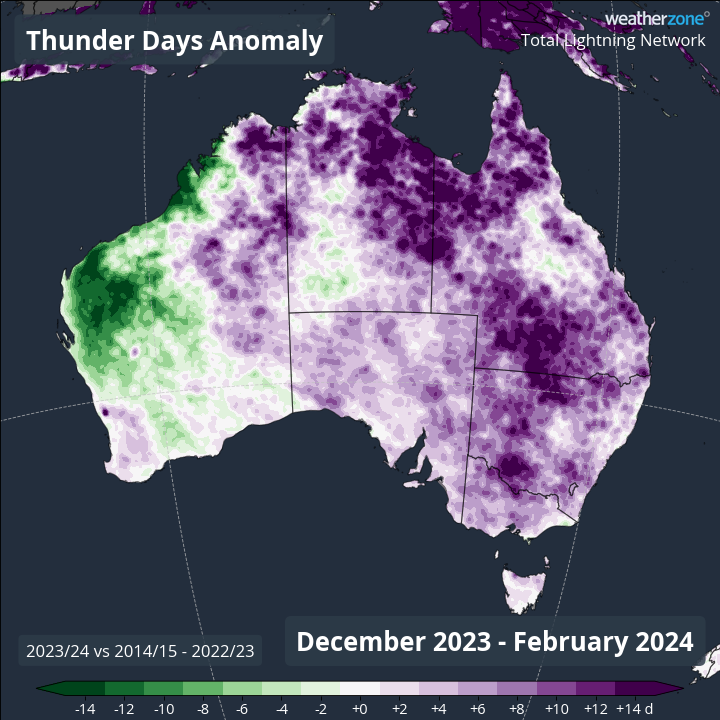
Images: Observed thunder days and thunder days anomalies for summer 2023-24 in Australia.
Of Australia’s capital cities, Darwin saw the most thunder days with 42 during summer, while Hobart had the least with just two. These numbers were slightly lower than average for summer in both cities.
Melbourne, Brisbane and Canberra all heard thunder more frequently than usual this summer, with each city registering around 5 to 6 extra thunder days compared to their seasonal averages.
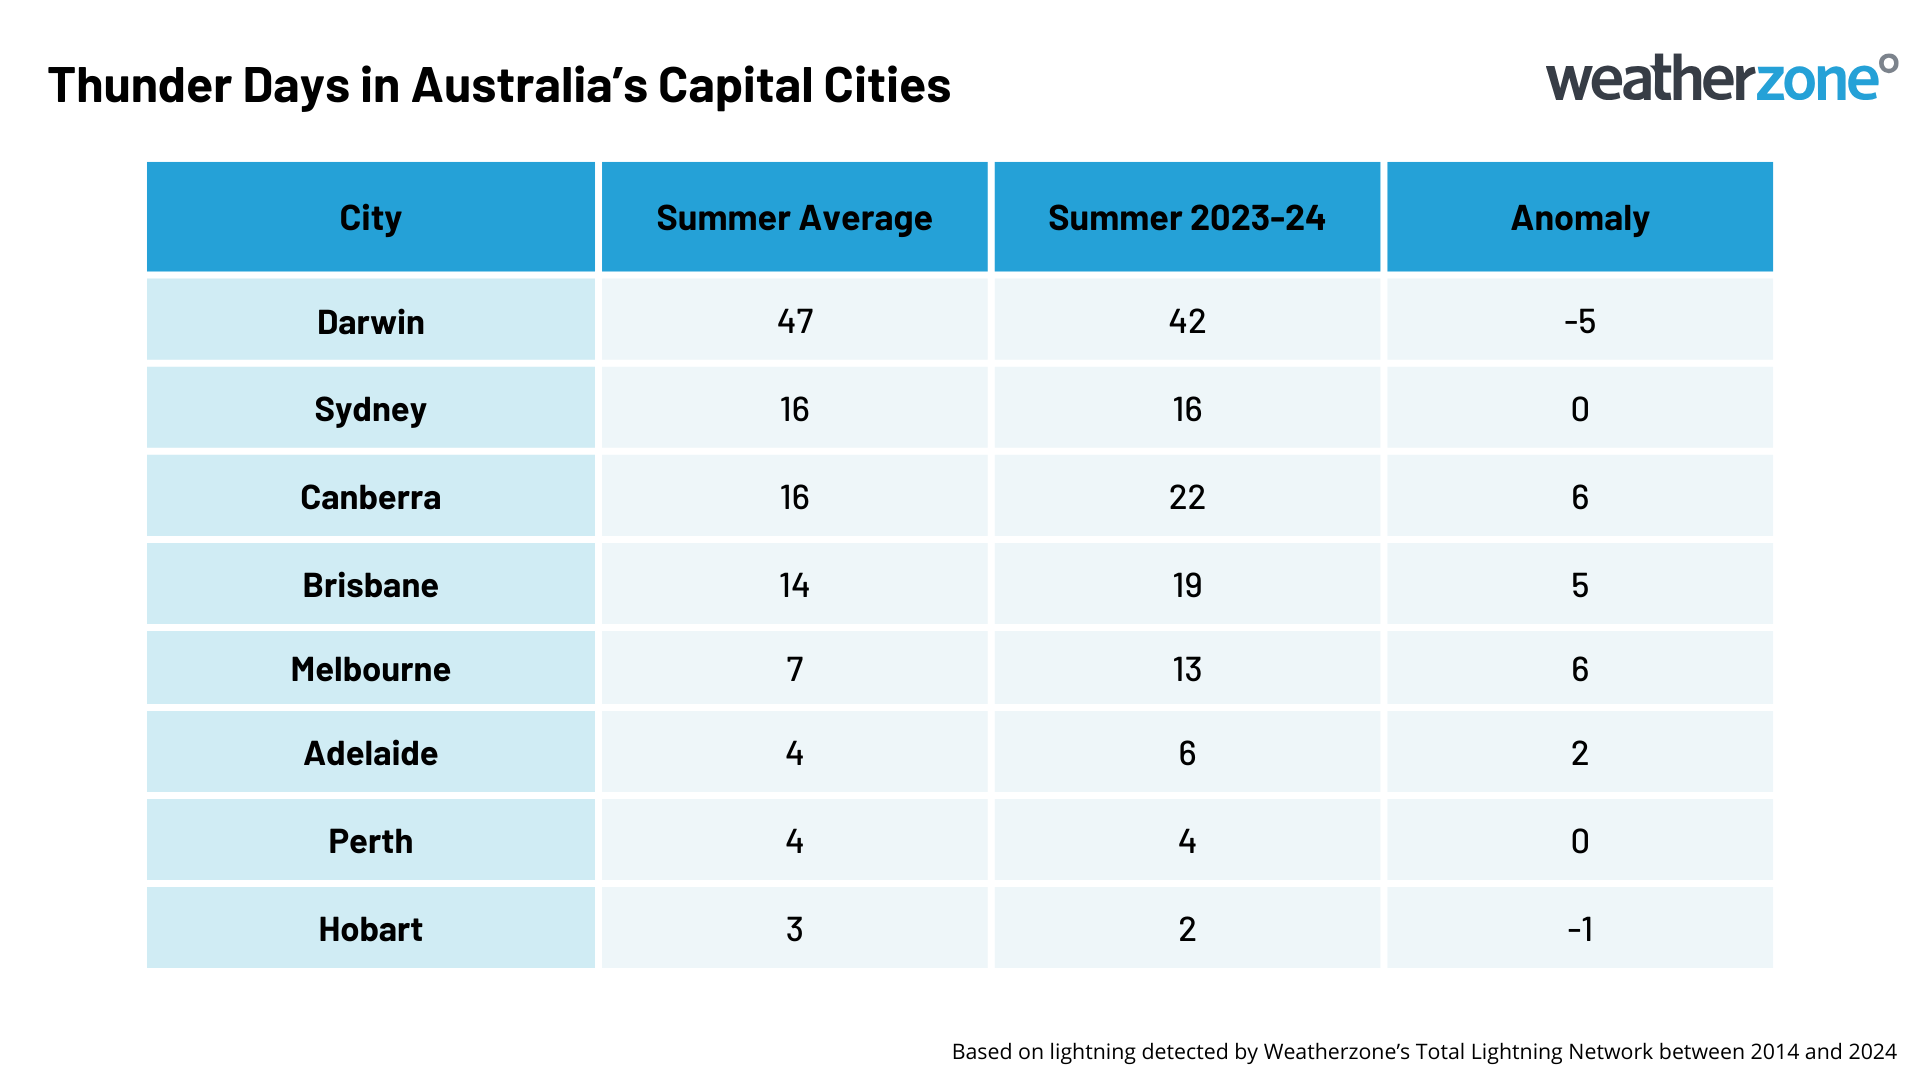
Image: Thunder days in Australia during summer 2023-24, compared to the long-term seasonal average.
Sydney and Perth saw their average number of thunder days this summer.
To find out more about our lightning and storm services, please email us at apac.sales@dtn.com.


