

Victoria just experienced it’s warmest autumn on record, but why?
Average temperatures across Victoria were 1.90°C above average throughout autumn 2025, which narrowly exceeded the old record set in 2016.
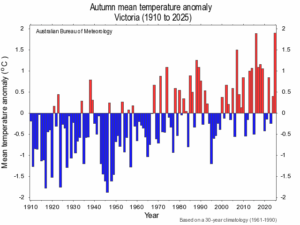
Image: Temperature anomalies in Victoria from 1910 to 2025. Source: BoM.
Australia as a whole was 1.41°C above average in autumn 2025, which made it our 4th-warmest autumn since national records were first kept in 1910.
No part of the country bucked the trend, with every state and territory significantly warmer than the long-term average, as shown in the map below of autumn 2025 temperature deciles.
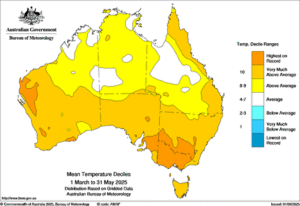
Image: Mean temperature deciles for Australia in autumn 2025. Source: BoM.
There are three patterns on the chart above worth noting:
- The first is the fact that no part of Australia saw below-average temperatures in autumn 2025, which points strongly to the underlying influence of the warming climate.
- The second point of interest is the white patches in outback Australia. Mostly, these are areas that experienced unusually heavy rainfall at times in autumn. Cloud and rain tend to make cooler weather, yet even a prolonged period of well below-average temperatures didn’t push these areas below the seasonal average.
- Thirdly, and on a similar note to the second point, NSW temperatures were above average overall despite heavy rainfall and flooding in some areas in autumn. Indeed, NSW saw a temperature anomaly of 1.94°C, which was slightly higher than Victoria’s record figure of 1.90°C, but not quite a NSW record (it was the 2nd-warmest autumn on record – behind the current record set in 2016).
Which climate driver lead to this southern warmth?
The main trend experienced this autumn was just how warm it was in Victoria, parts of SA and southern NSW. This was largely due to the predominantly positive Southern Annular Mode (SAM) and the associated absence of rain-bearing frontal systems as high pressure dominated over southeastern Australia.
What is the Southern Annular Mode (SAM)?
The Southern Annular Mode (SAM) is an index used to monitor the position of the westerly winds that flow from west to east between Australia and Antarctica. When the SAM is in a negative phase, these westerly winds, and the cold fronts and low pressure systems they carry, are located further north than usual for that time of year. When the SAM is positive, the westerly winds, cold fronts and low pressure systems are located further south than usual.
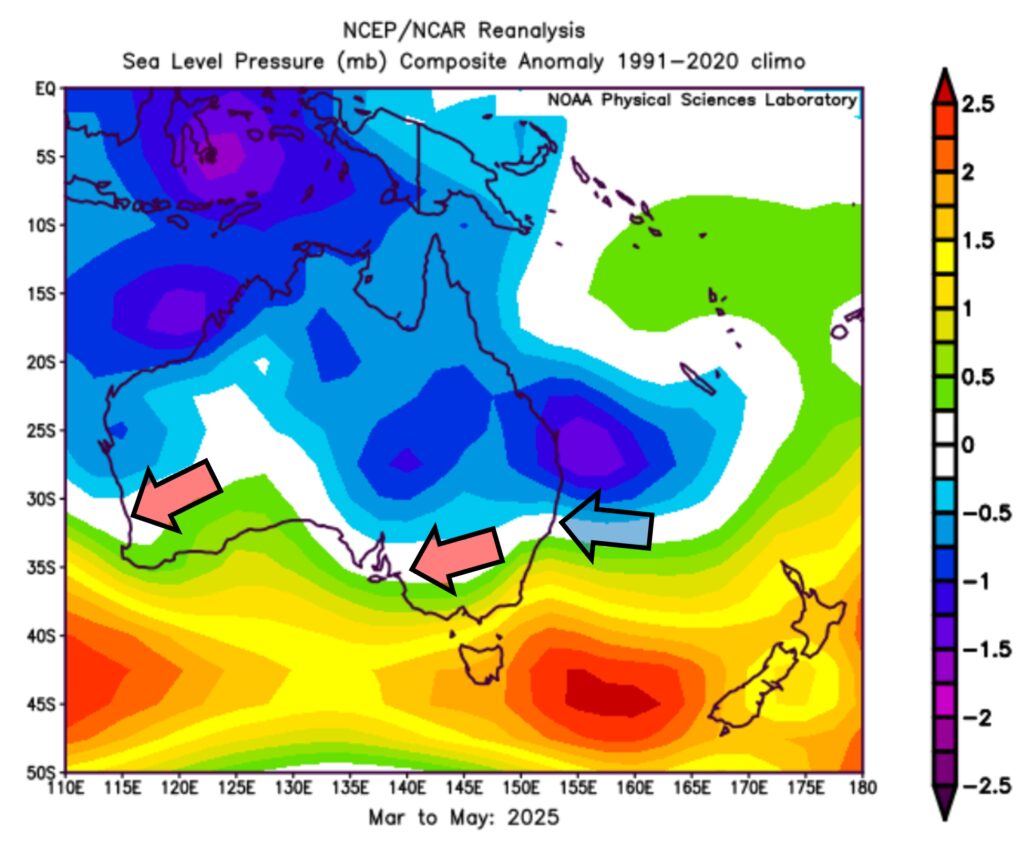
Image: Mean sea level pressure anomalies between March and May 2025. Source: NOAA
Abnormal high pressure across the south of Australia keeping cold fronts from crossing over the continent also directed more easterly winds across the country’s south. These winds started off loaded with humidity (as seen with the blue arrow above), dumping heavy rain into Queensland and eastern NSW, before becoming hot and dry moving into southern NSW, Victoria and South Australia, as well as WA (as seen with the red arrows above).
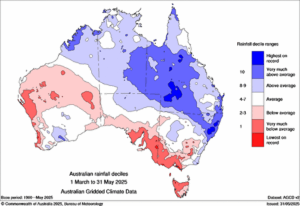
Image: Australian Rainfall deciles for autumn 2025. Source: BoM.
As the map above shows, large parts of southern Australia experienced relentlessly and record dry conditions in autumn 2025, with Victoria registering its ninth-driest autumn on record overall, and Tasmania its third-driest.
Conversely, Queensland experienced it’s sixth-wettest on record (and wettest autumn since 1990) with heavy rainfall leading to significant outback flooding in March. Southeast Queensland and eastern NSW also experienced record rainfalls, notably with the landfall of Tropical Cyclone Alfred in early March, and with historic flooding over NSW’s Mid North Coast district in May.
As reported by Open Electricity, May was a big month for the National Energy Market (NEM), with the highest production in a calendar month of:
- Hydro generation over a calendar month in Queensland
- Wind generation over a calendar month in Queensland
- Battery charge and discharge over a calendar month in the NEM, Victoria, South Australia and NSW
The uptake in renewable energy generation by Queensland over the past years has led to this increasing contributions of hydro and wind generation, along with favourable weather promoting wetter and windier (but less sunny) conditions over the state.
What’s to come in the next few months?
As mentioned in our in depth winter outlook, southeastern Australia can expected more periods of positive SAM to start off winter. While fronts should still cross the southeast, blocking highs are more likely to remain static for weeks on end, keeping southern Australia drier and warmer than normal.
A negative Indian Ocean Dipole (IOD) event could develop through the second half of winter, potentially shaking things up and sending moisture from the northwest shelf across the country.
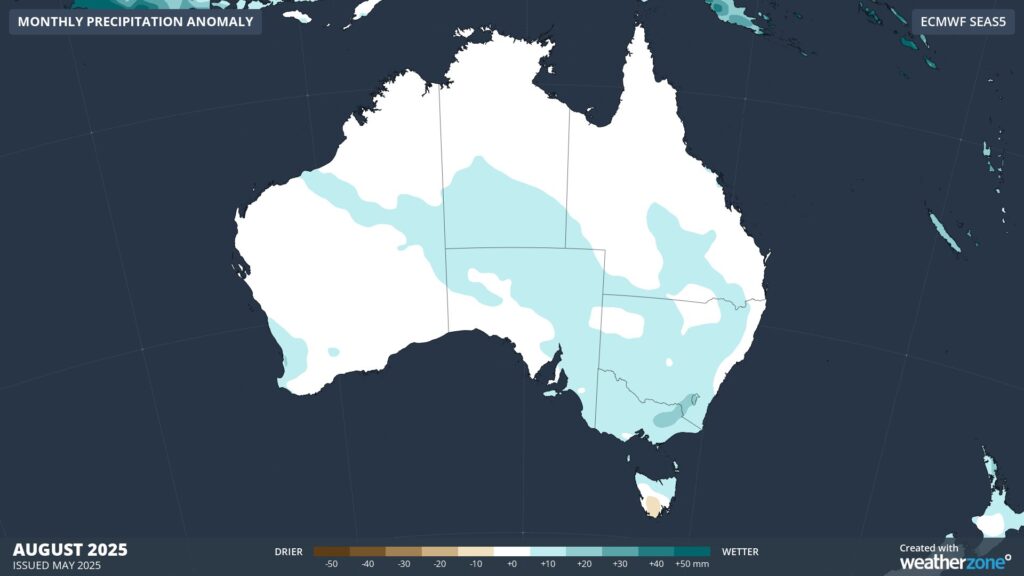
Image: Australian rainfall anomaly forecast for August 2025.
How DTN APAC can help you plan for upcoming seasons
From Aviation to Energy across Australia, Asia Pacific, and globally, you can strengthen your business’ response to weather impact when you work with our diverse team, bringing you global forecasting, product development, and analytics expertise.
We work hard to identify your operational pressures and tailor our services and products to meet your needs. Concise communication, giving you full situational awareness exactly when you need it, is our focus. We want to reduce weather risk in your operations, every day.
Whether it’s preparing for the 2025–26 tropical cyclone season, or simply ensuring your operations team is equipped to confidently make decisions ahead of severe weather, our weather Risk Communicators are here for you.
Our weather risk communicators deliver short- to long- term guidance from:
- hourly-event weather monitoring (alerting you of impending thunderstorms)
- week to month operational planing based on likely timing of increased wind and/or rain
- seasonal long term planning based on climate drivers and the likely trends across the coming months.
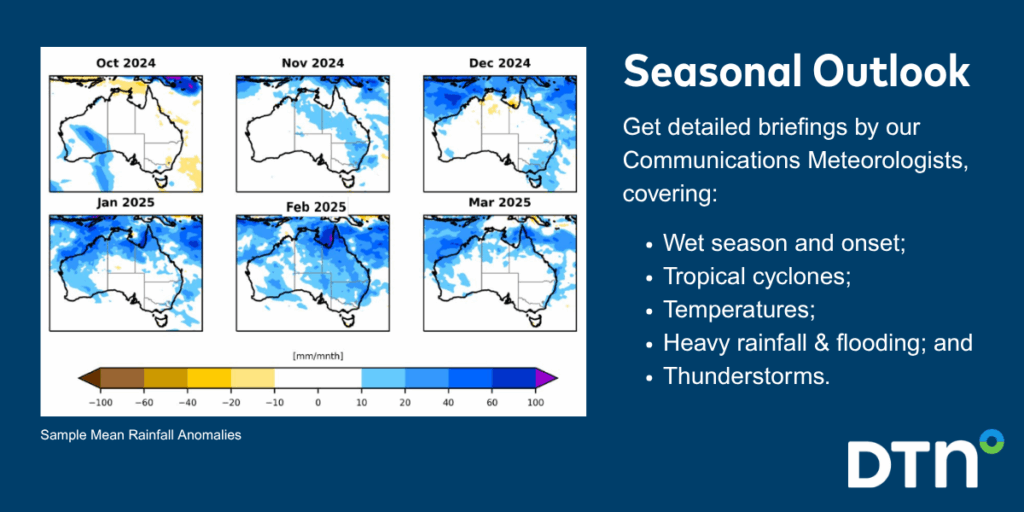
We deliver clear and comprehensive weather data, personalised risk assessments and briefings to you and your team, so that your critical decisions can be made with confidence.
We are available 365 days a year, so you always have the timely guidance you require, especially when severe conditions hit.
You have our insights to rely on to see you through complex situations, minimising potential loss of profit and maximising the safety of your staff and assets.
Learn more about our large range of industry leading products and services or email us at sales.apac@dtn.com
Thumbnail source: iStock / ymgerman






