
A stubborn blocking high over southern Australia will make for a very quiet week for wind generation and the pattern behind it isn’t a one-off.
It’s the seasonal signature of a super (very strong) El Niño combined with a positive Southern Annular Mode (SAM), and both the historical record and the current seasonal forecast suggest it’s likely to keep recurring through spring before a potential switch from November.
The setup right now
An exceptionally strong blocking high of 1032 hPa is anchored over the Great Australian Bight is forecast in the evening on Thursday 17 September 2026. The forecast high is sturdy even by the standards of positive-SAM events.
The ECMWF analysis below shows a very slack pressure gradient, which is shown by the large gaps between the white lines or isobars surrounding the high. This pressure gradient is conducive to very light winds at the surface, likely impacting the National Electricity Market’s (NEM) wind fleet.
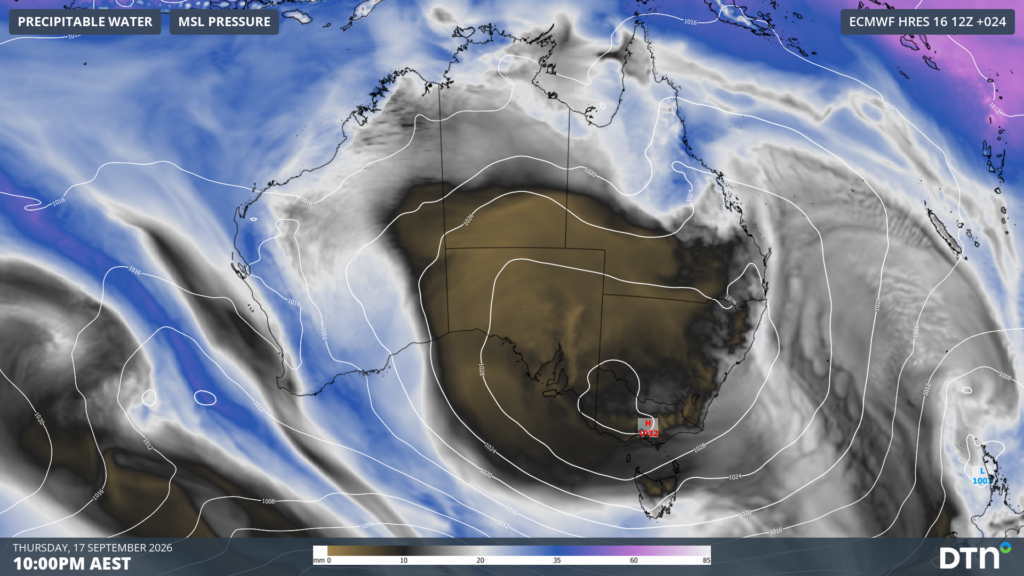
Image: Mean Sea Level pressure and Precipitable water forecast at 10pm AEST on Thursday September 17. Source: DTN and ECMWF
The map above also shows precipitable water, with the blue to purple shades indicating abundant moisture in the atmosphere, while on the other end of the scale the black to yellow is showing low moisture.
Almost all of the continent is showing the classic dry, still, high pressure signature that comes with a blocking system parked in place rather than moving through. Meanwhile moisture is pouring into WA as the high draws in moisture-laden air from the exceptionally warm waters across much of the Indian Ocean Basin. This is the setup we could see repeatedly in spring, with potential for above average rainfall across WA and parts of central Australia despite El Niño.
This is the same mechanism behind previous documented low-wind weeks in the NEM. In comparable blocking-high setups, the wind’s share of NEM generation has been recorded dropping as low as 2–6%, against a typical yearly average closer to 13% and this week’s actual 5-minute NEM data confirms a similar story.
The GFS 10-day mean-average MSLP panels show the strong blocking high over the next few days, with a temporary break, followed by a secondary block forming further east.
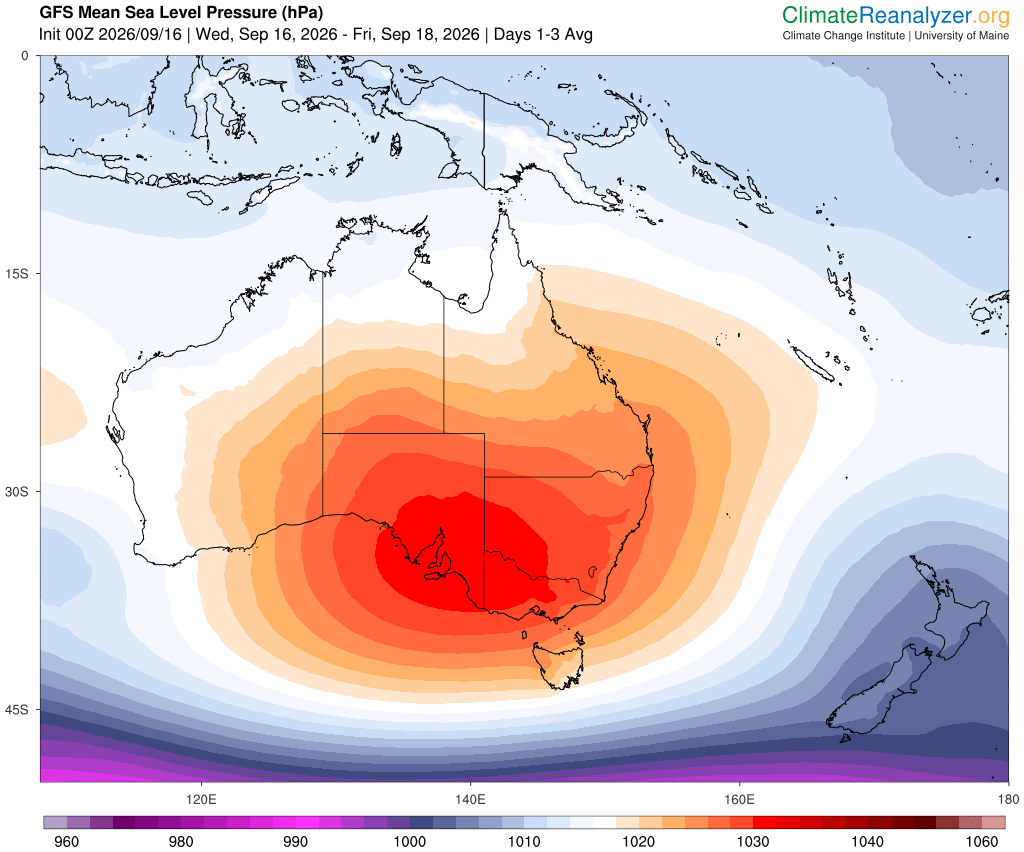
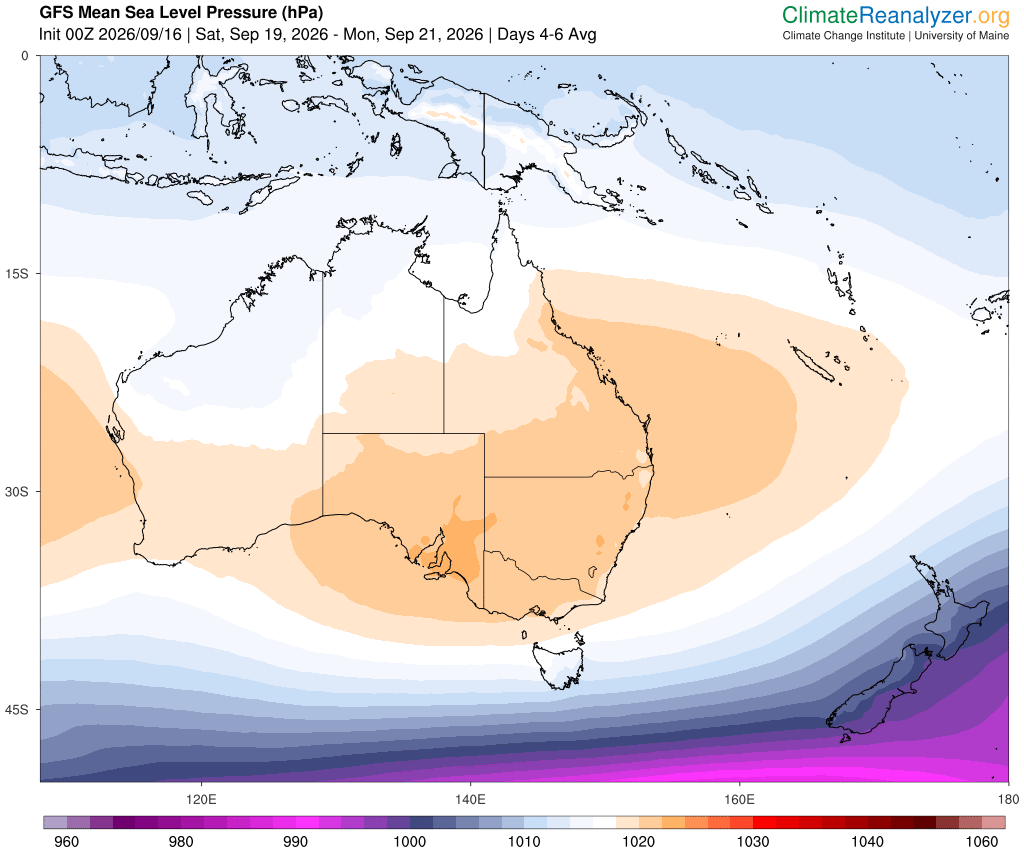
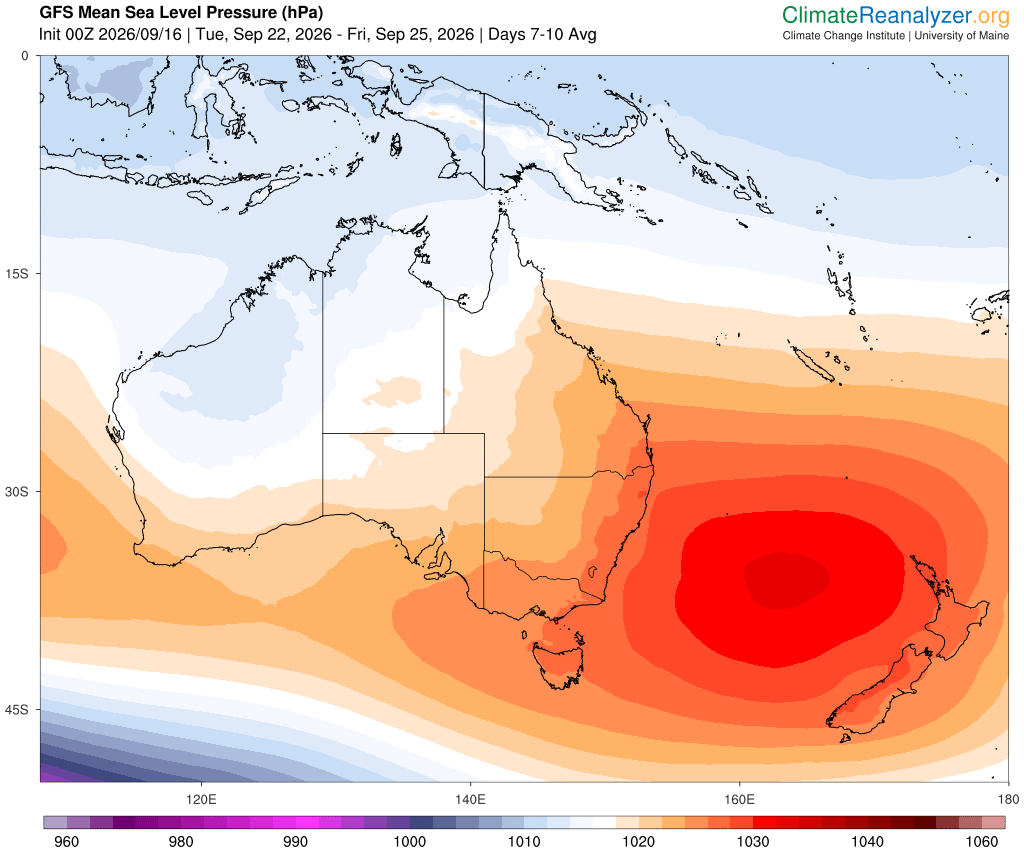
Images : GFS Mean Sea Level Pressure (hPa) for the next 10 days (top to bottom). Source: ClimateReanalyzer
Why this week isn’t an outlier
Across the wind speed anomaly composites for spring across three of the strongest El Niño years on record (1997, 2015 and 2023) similar structure recurs in each. The maps below show a belt of reduced wind speed across southern and central Australia and the Tasman Sea, broadest and most consistent in 1997 and 2015, still visible in 2023.
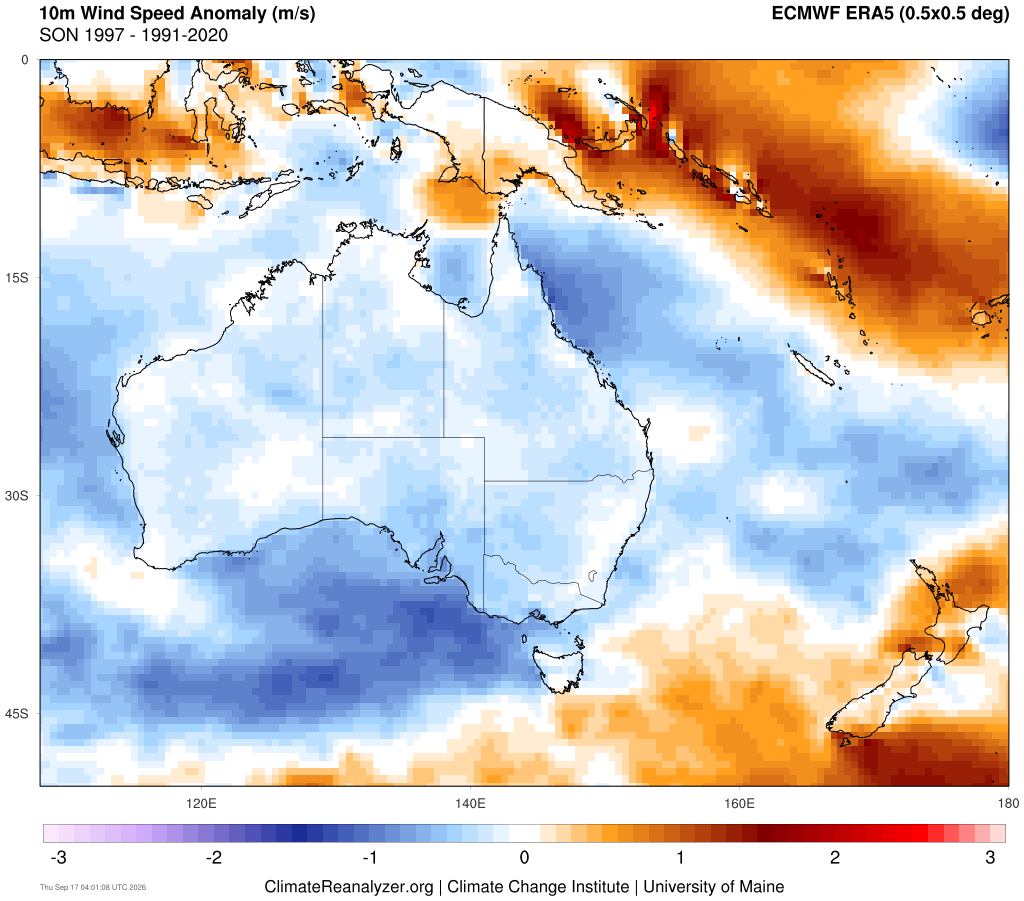
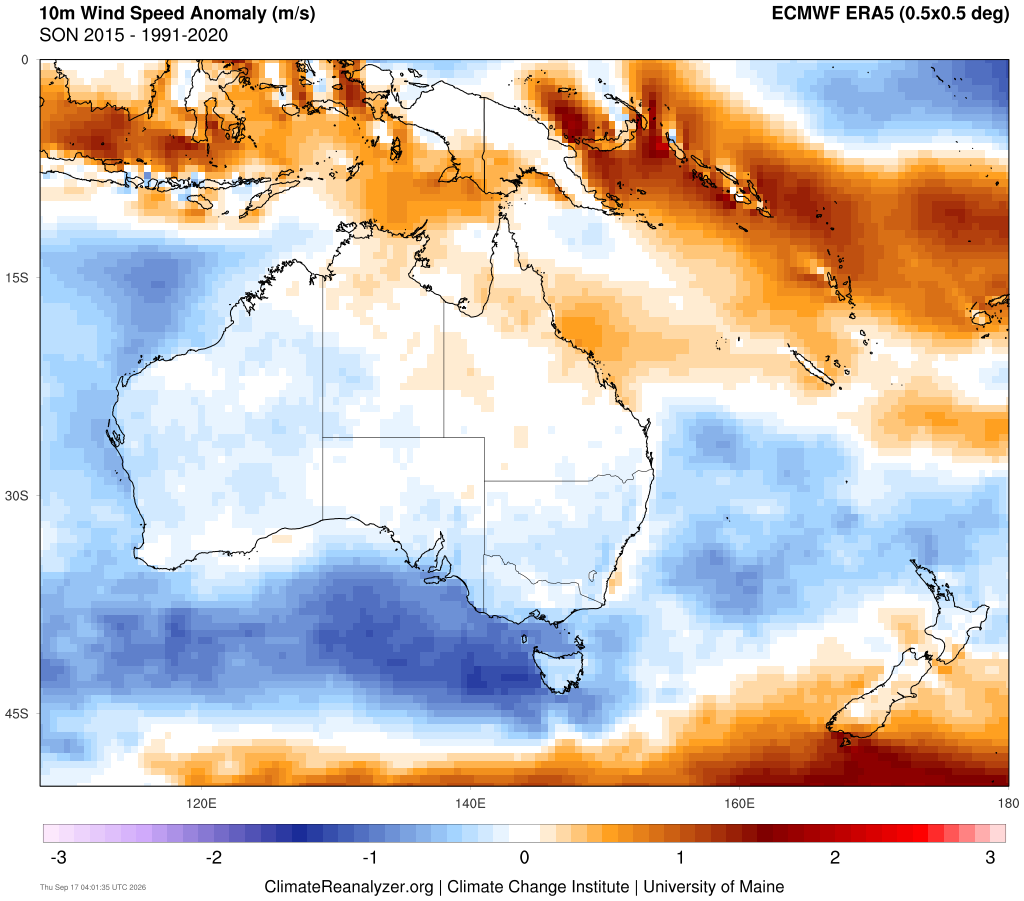
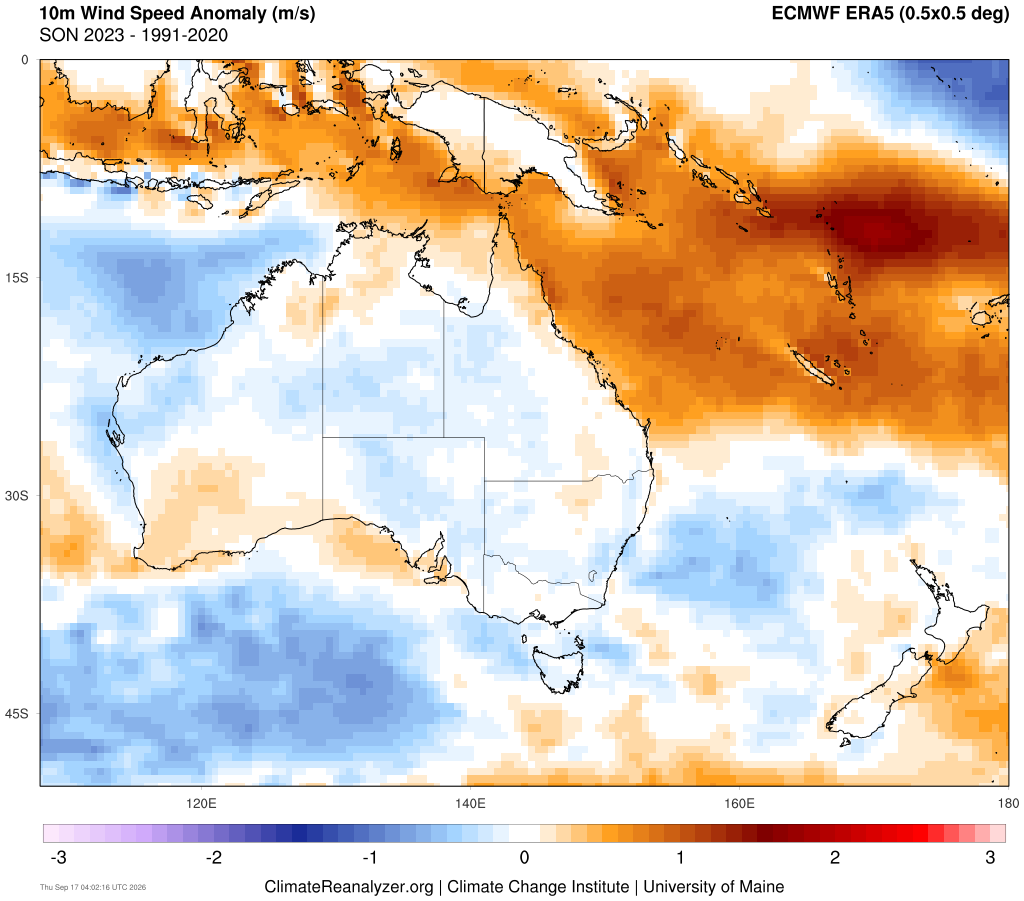 Images: 10-metre wind speed anomaly (m/s) for spring during 1997 (top), 2015 (middle), and 2023 (bottom). Source: ClimateReanalyzer
During these analogous years the SAM was either neutral to negative, showing that El Niño and the subsiding air it causes over Australia brings higher pressure and lower winds at the surface despite the SAM phase.
How long is this likely to last?
Forecast average-MSLP anomaly maps for the coming months suggest the low-wind pattern will continue through until around November. The map below show positive MSLP anomalies cover the whole continent for spring, influenced by the strong El Niño and positive SAM forecast.
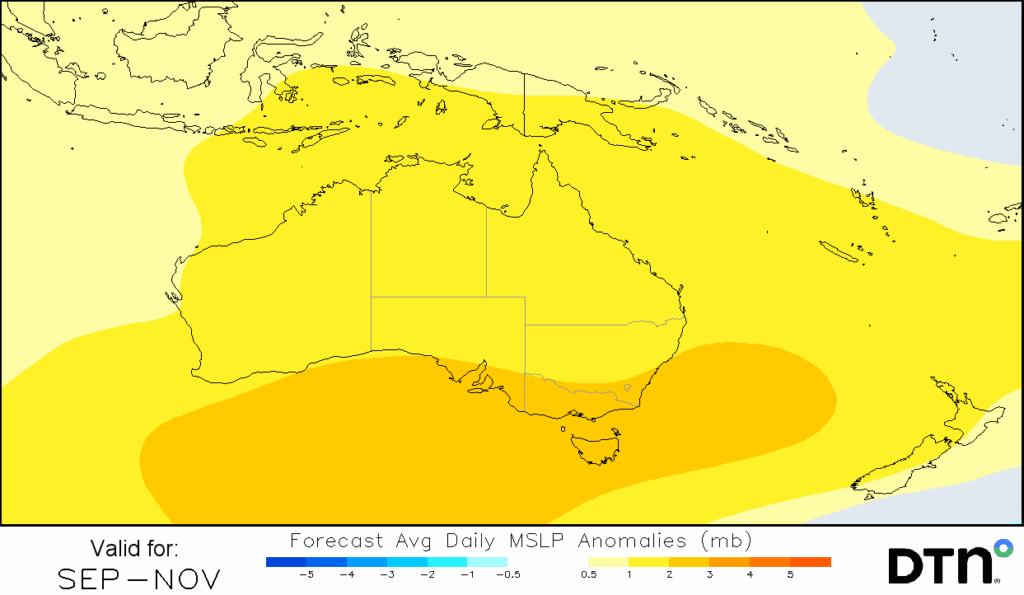
The set up above points to the low-wind, blocking-high pattern being at its strongest through spring, meaning this week is more likely the first of several wind lulls.
DTN APAC provides tailored seasonal weather briefings and climate outlooks that help enterprises manage extreme weather risks across the Asia-Pacific region. These operational briefings focus on high-stakes weather phenomenon such as:
- Tropical cyclones,
- Bushfires,
- Extreme heatwaves, and
- Wind power for electricity networks heavily analysing key regional climate drivers like El Niño and the Indian Ocean Dipole (IOD).
Learn more about our experts or how we can support your Renewables operation today.




