

Leonora, WA, had its wettest September day on record earlier this month. Three weeks later, more than 1.3 million lightning pulses were detected within 800 km of the town in 48 hours. Why is a stalled trough delivering storms to mining country, and what it could mean for operations?
The DTN Total Lightning Network detected 1,383,798 lightning pulses from thunderstorms within 800 km of Leonora in the 48 hours to 8am AWST on Monday, 28 September, with about 900,000 of them in the final 24 hours. Kalgoorlie-Boulder Airport collected 66 mm of rain from thunderstorm activity between Friday morning and Monday morning, roughly five times its September monthly average.
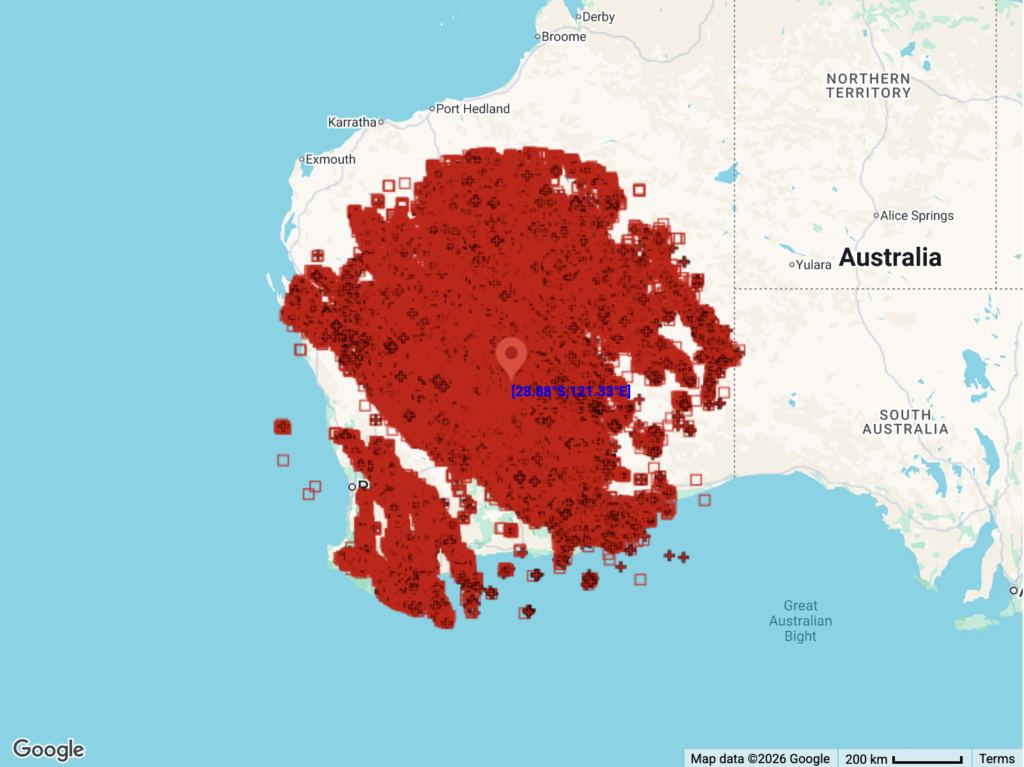
This month’s recurring storms are associated with El Niño and a weakly positive Indian Ocean Dipole index, which could develop into a positive IOD event later this spring. Positive IOD events make high pressure systems more common south of Australia and help trap storm-producing troughs over WA. Storms aren’t unusual in WA at this time of year, but this system produced an unusually large amount of lightning over the same area for a prolonged period.
The map below shows El Niño’s typically effect on rainfall during the later part of the year, with parts of central WA notably wetter.
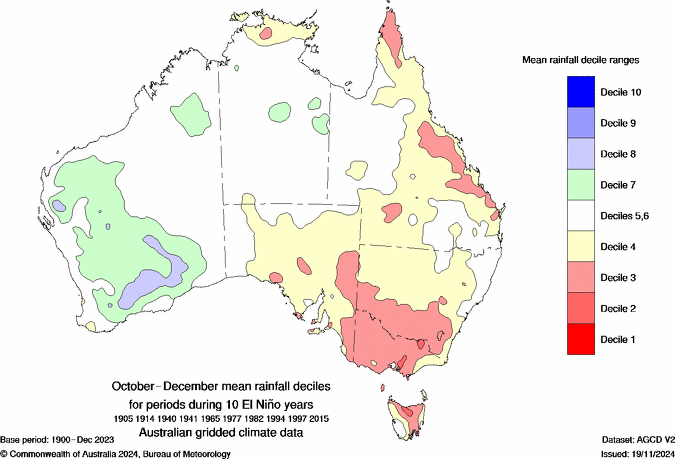
Image: October to December mean rainfall deciles during 10 El Niño years. Source: Bureau of Meteorology.
The Leonora rainfall record came earlier in the month. On Monday, September 7 the town recorded 58.8 mm, well above the previous September daily record of 32.6 mm, set in 1984. Flooding closed two major roads around the town for extended periods, and the Leonora to Laverton Road was still shut the next day. In late August, DTN counted more than 288,000 lightning strikes above WA between the 26th and 30th.
Why it matters for Mining
The northern Goldfields is a network of remote pits, processing plants and haul roads that depend on open ground, long road links and reliable power. That leaves it exposed to this kind of weather:
- Lightning: Open-cut operations and outdoor work are in the firing line when storms stall. DTN, which sells lightning detection, describes lightning as a key consideration for mining and other outdoor operations.
- Flooding and access: Leonora shows how quickly roads can be cut in a region where September is normally the driest month.
What’s next?
DTN meteorologists expect storms and rain across a broad area of WA from Monday until at least Friday, with at least another million lightning strikes and 30 to 60 mm more rain in some areas.
Where is the moisture coming from?
Moisture-laden tropical air from the Indian Ocean is feeding into a trough over the state, fuelling the thunderstorm activity.
NOAA Coral Reef Watch’s sea surface analysis for 26 September shows warmer-than-normal water across much of the tropical Indian Ocean, with a hotspot roughly 2 to 3°C above average well off WA’s northwest coast. However, seas around Indonesia are cooler than normal, a sign of a potential developing positive IOD. That warm-west, cool-east contrast is the pattern associated with a positive Indian Ocean Dipole, although the IOD index needs to remain above the positive threshold for a few more additional weeks for it to have an impact on our weather.
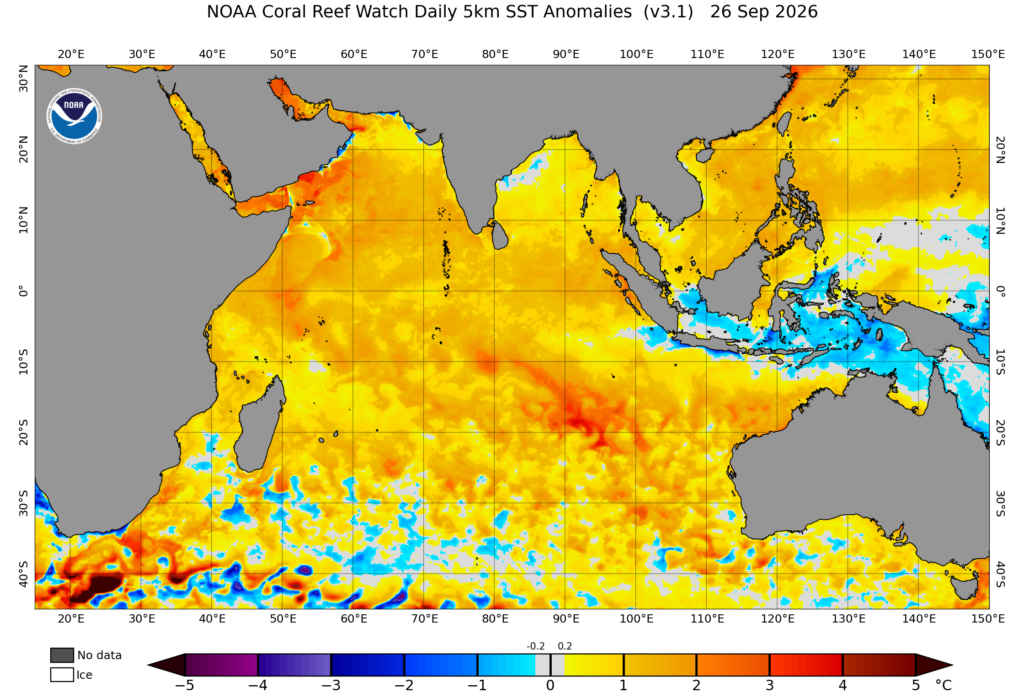
Image: NOAA SST anomaly, 26 September 2026 showing warmer-than-normal water across the Indian Ocean, cooler water around Indonesia, 26 September. Source: NOAA Coral Reef Watch.
The signs were there in August
August saw above to very-much-above average across a broad belt of the interior, from the Pilbara and Gascoyne through the central and southern interior. Rainfall analysis for the week ending 31 August shows much of that rain falling in the last week of the month.
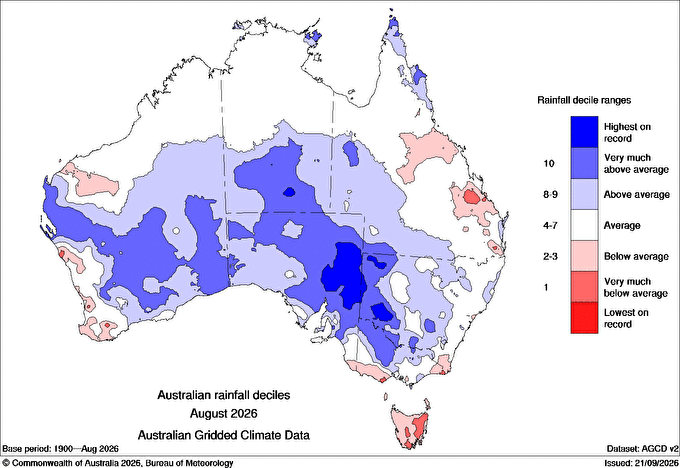
Image: Australian rainfall deciles for August 2026. Source. Bureau of Meteorology.
Like September, the rainfall was caused by the position of high pressure anomalies (shown below) and a prevailing northwesterly flow over WA, drawing moisture from the anomalously warm Indian Ocean basin.
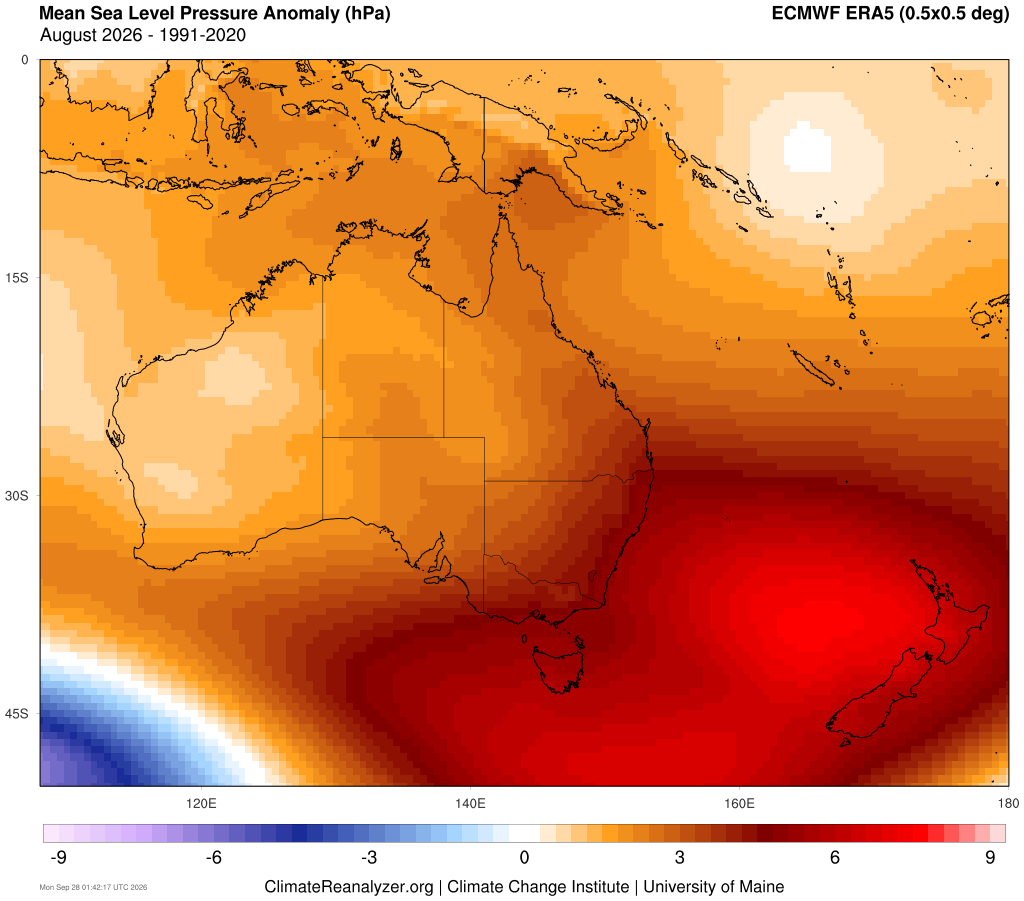
Image: Mean Sea Level Pressure anomaly showing high pressure over Australia during August, particularly in the southeast. Source: ClimateReanalyzer.org, Climate Change Institute, University of Maine; ERA5, August 2026 vs 1991-2020.
ERA5 reanalysis data from the University of Maine’s Climate Reanalyzer shows August air moisture (precipitable water) well above the 1991-2020 average across parts of WA’s north and west, while Indonesia and Papua New Guinea were anomalously dry. Air pressure was above average across southern and southeastern Australia, with a strong high east of Tasmania.
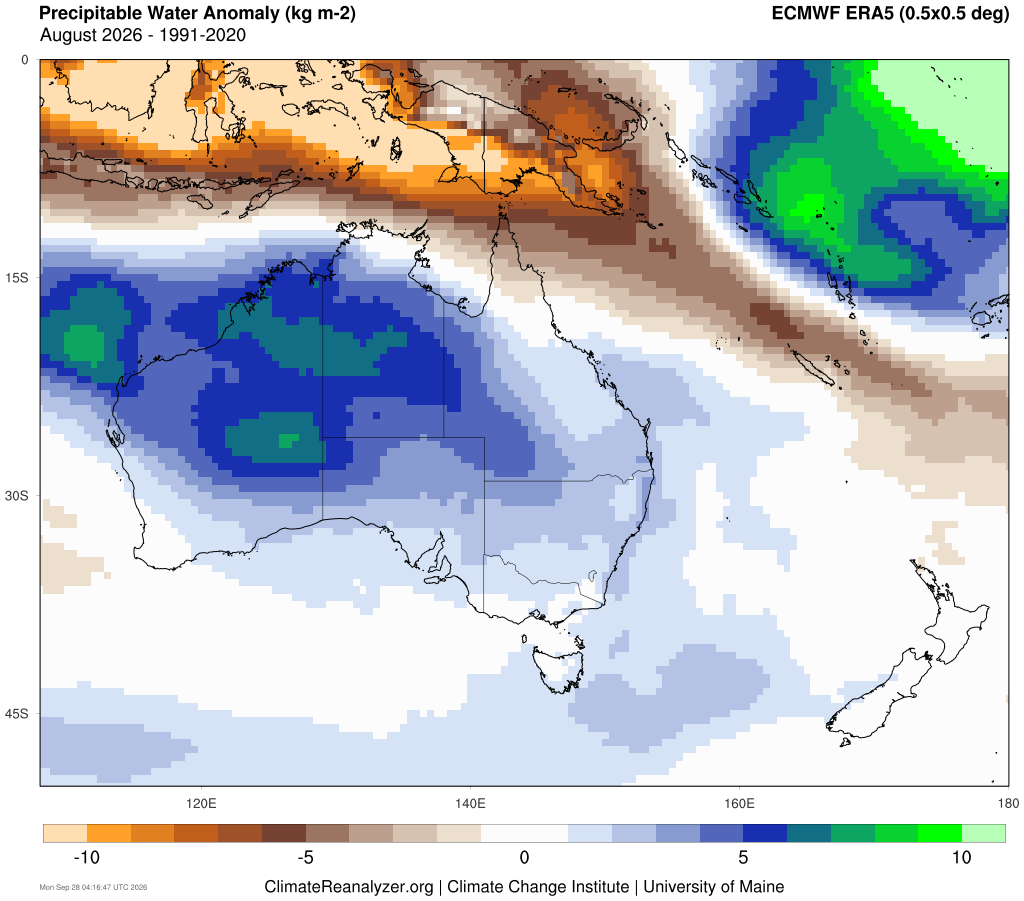
Image: Air moisture (precipitable water anomaly) ran above average over parts of WA in August. Source: ClimateReanalyzer.org, Climate Change Institute, University of Maine; ERA5, August 2026 vs 1991-2020.
The week ahead
The trough will likely keep producing storms across a broad area of WA this week. For an industry that plans around road access, power and outdoor work, detailed forecasts on the week ahead are very important.
DTN APAC offers weather intelligence supporting the end-to-end scope of Mining operations, allowing leaders and crew to make decisions confidently every step of the way. Reach out to us today at sales.apac@dtn.com




