New data has revealed that the Southern Hemisphere just saw a record-breaking run of positive Southern Annular Mode (SAM) values, and this run is set to continue until at least the end of the year. Here’s what that means for Australia.
What is the Southern Annular Mode?
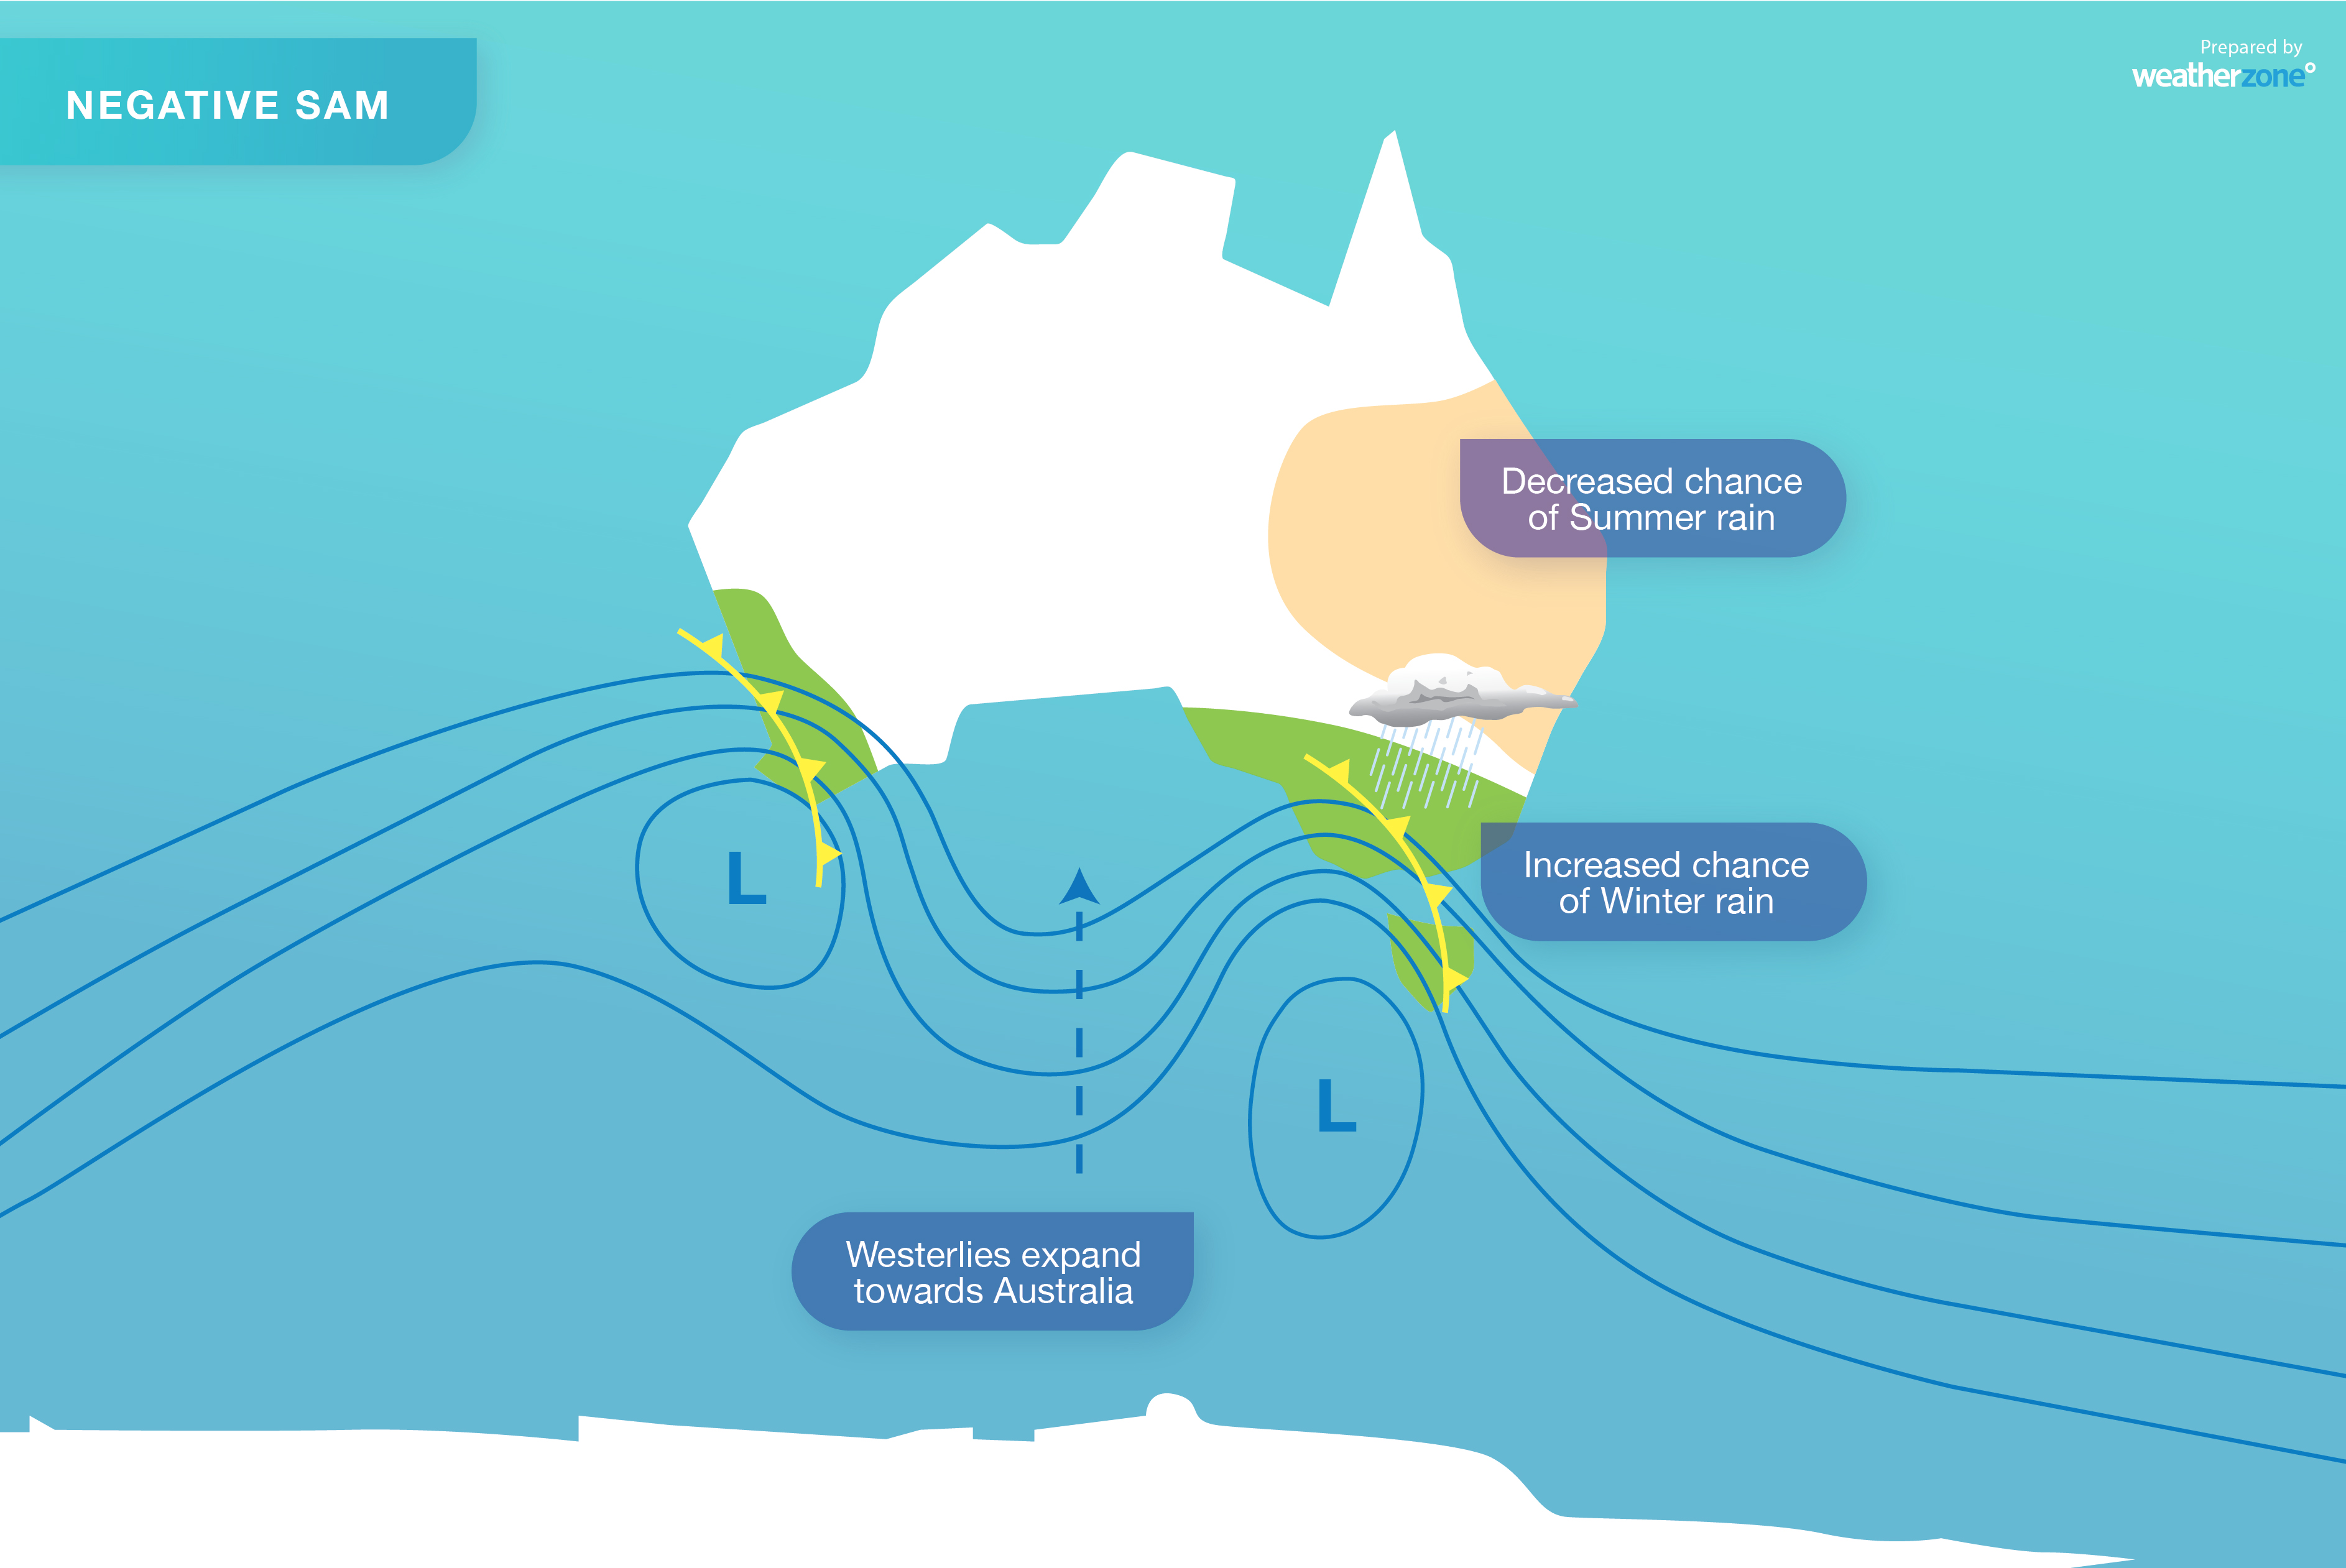
The SAM is simply an index that’s used to monitor the position of a belt of westerly winds that flow from west to east between Australia and Antarctica. When the SAM is in a negative phase, these westerly winds, and the cold fronts and low pressure systems they carry, are located further north than usual for that time of year.
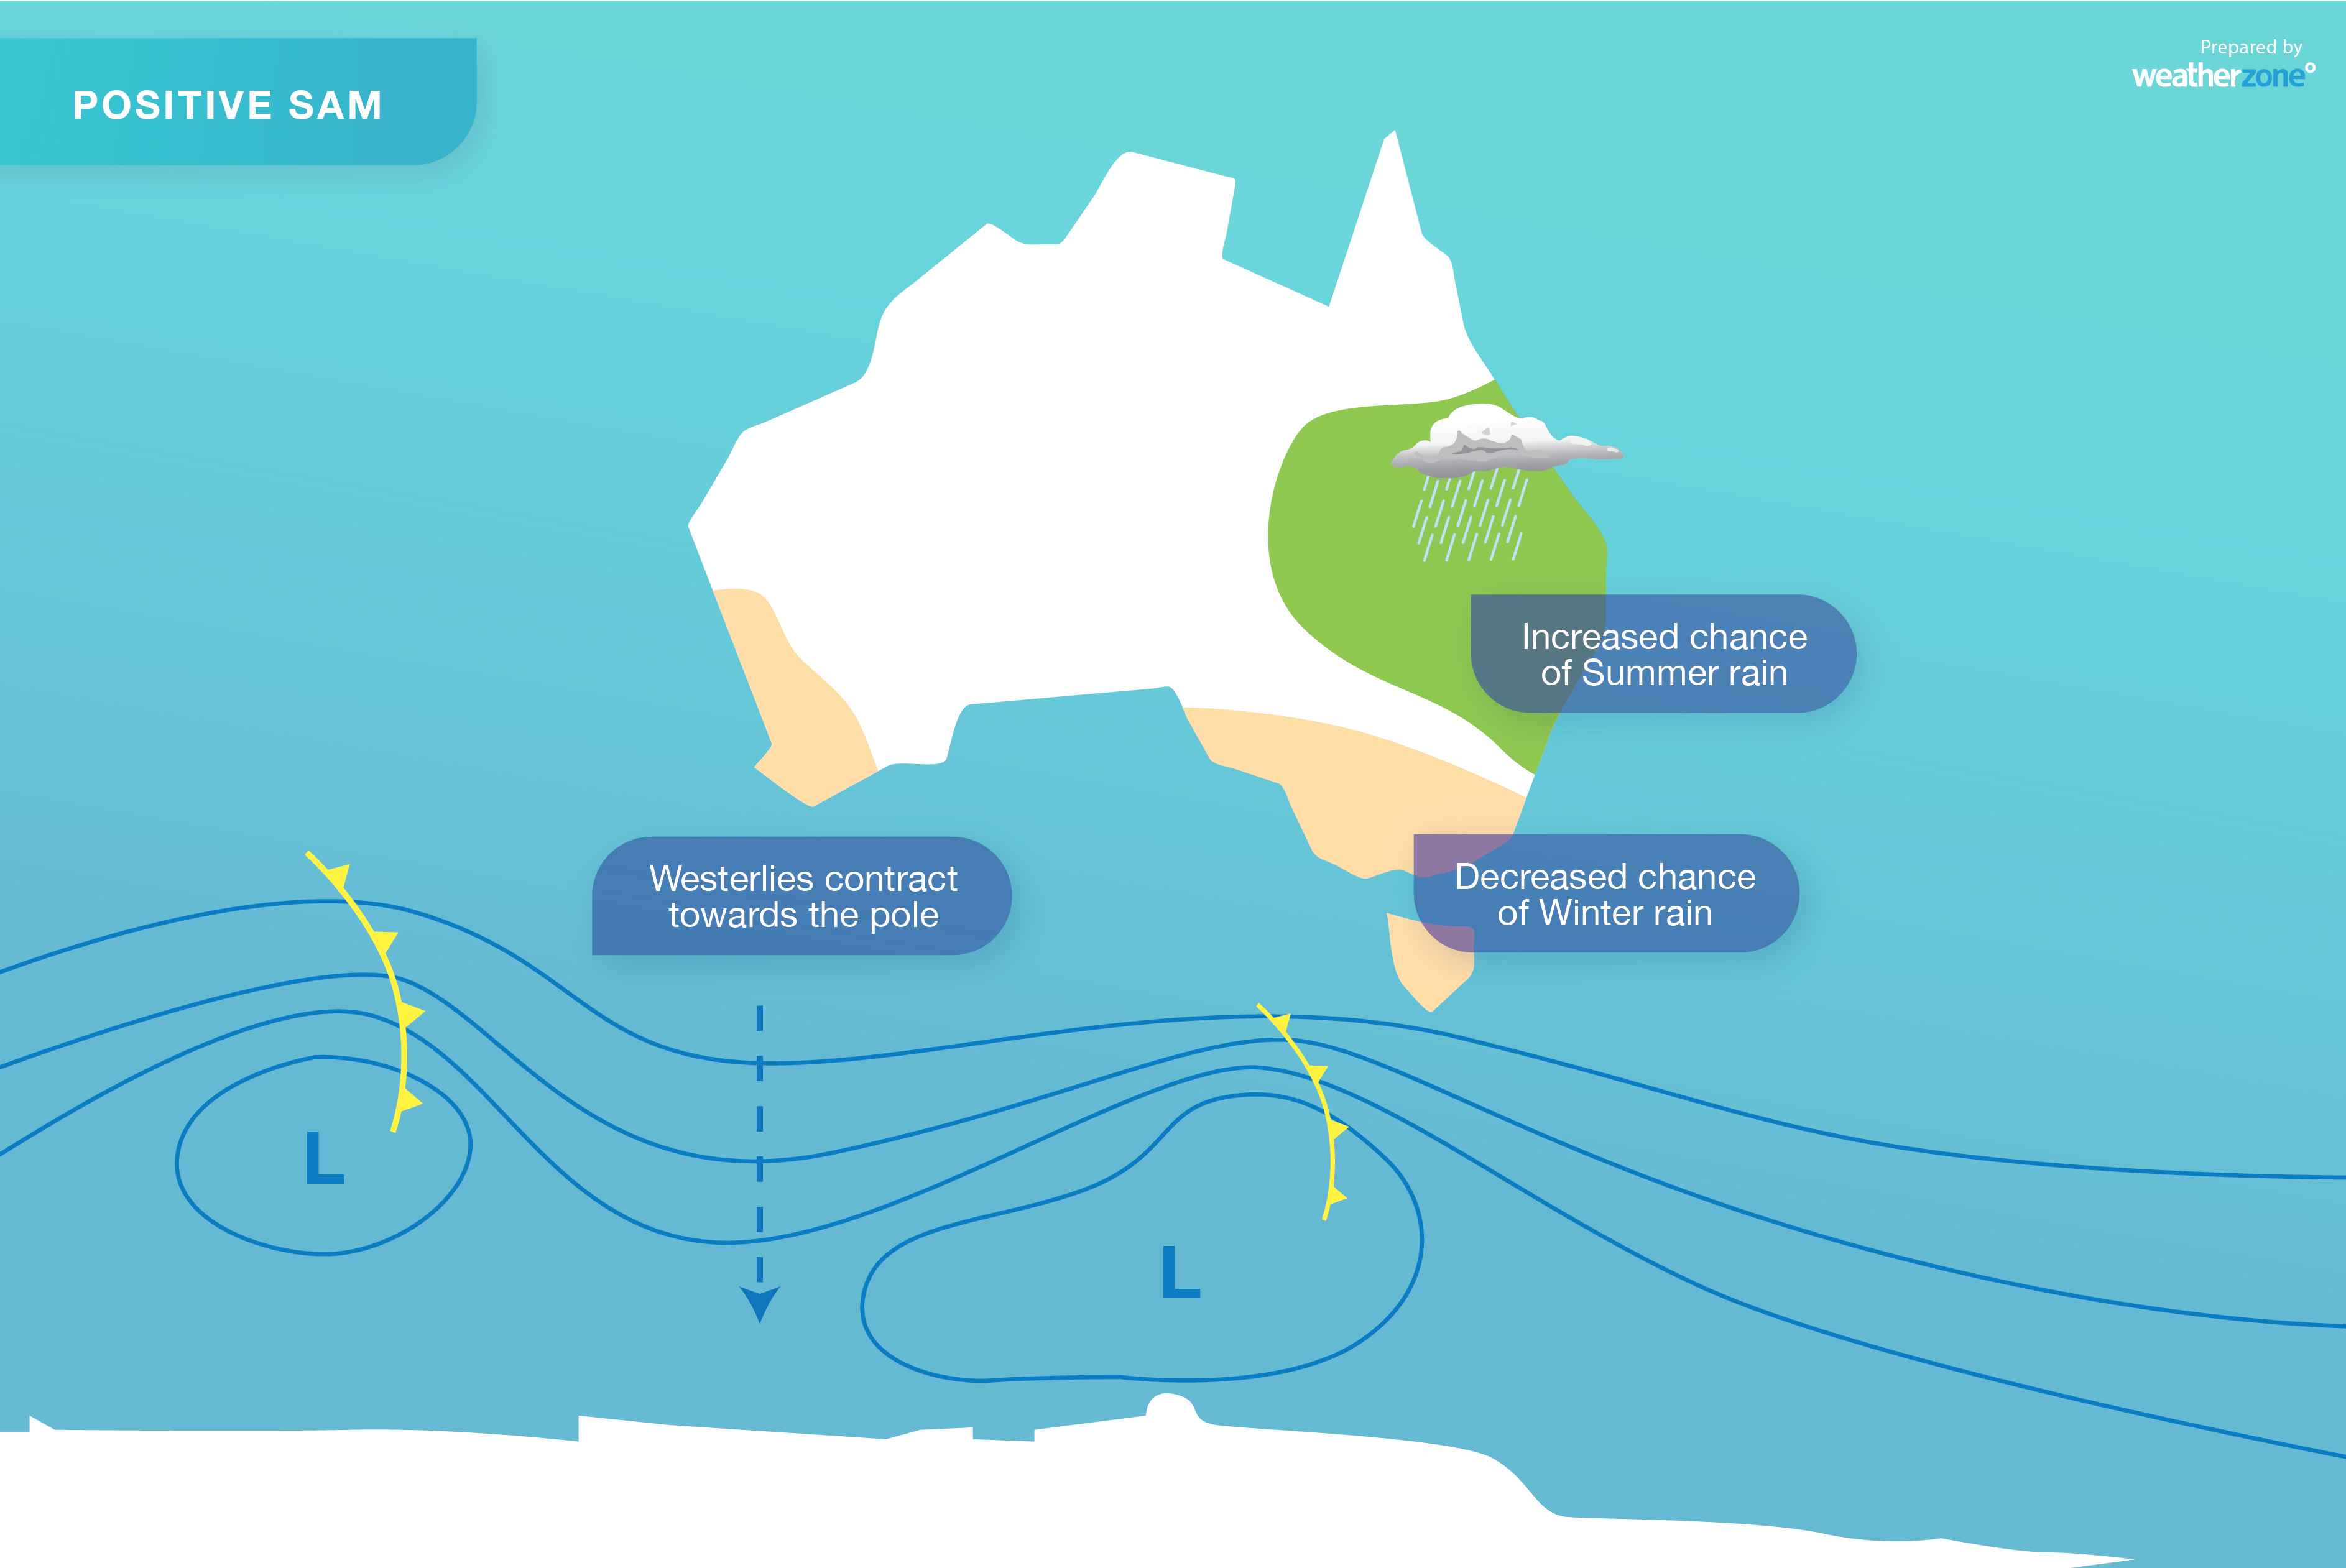
When the SAM is positive, the westerly winds, cold fronts and low pressure systems are located further south than usual. The SAM can have a notable impact on Australia’s weather. Negative phases of the SAM during summer can:
- Reduce rainfall over southeast and eastern Australia.
- Promote strong westerly winds over southern Australia, increasing wind power generation.
By contrast, positive phases of the SAM in summer can:
- Reduce wind power generation in southern Australia.
- Increase rain over eastern and southeast Australia.
- Reduce the chance of extreme heat.
A recent example of negative SAM’s influence on Australia’s weather was the 2019/20 Black Summer. During that season, strong westerly winds from the interior promoted dry, hot and windy weather across eastern Australia. These conditions led to record-breaking heat and a very dangerous fire season, with millions of hectares burnt across NSW, QLD and VIC.
By contrast, this season’s run of positive SAM has helped cause record-breaking rain and below-average temperatures and bushfire activity in eastern Australia.
Why has the SAM been positive for so long?
Positive phases of the SAM are more likely during La Niña, which is currently underway in the Pacific Ocean and should last until at least late-summer. The SAM can also be influenced by the strength of the Southern Hemisphere’s polar vortex, which is a ring of powerful westerly winds that develop around Antarctica during the colder months of the year.
When the polar vortex is stronger than usual, the westerly winds encircling Antarctica flow faster than normal. By contrast, a weak polar vortex occurs when the westerly winds around Antarctica ae weaker than usual.
A strong polar vortex in winter and early spring will usually cause more positive phases of the SAM during late spring and summer. This flow-on effect has been seen this year, with a strong and long-lasting polar vortex causing a lengthy run of positive SAM.
According to Dr Amy Butler, an atmospheric scientist and polar vortex expert at NOAA’s Chemical Science Laboratory, this year’s polar vortex has lasted into early December, making it one of the longest-lasting on record for the Southern Hemisphere.
This strong polar vortex is one of the main reasons we have seen such a long run of positive SAM values in recent months.
Data from NOAA shows that the SAM was positive for 45 consecutive days from mid-October to the end of November. According to Dr Butler, this is a new record for the spring period (September to November).
(1/n) By my calculations, the SAM/AAO has just had the most consecutive days (45) above zero during the Sept-Nov period in the satellite record. The SAM has continued to stay positive into December. pic.twitter.com/8Dtp4JcEyh
— Dr. Amy H Butler (@DrAHButler) December 7, 2021
Forecast models show that the current sustained run of positive SAM values should continue through until at least the end of December and into the start of next year.
What does this mean for Australia’s weather?
The positive SAM helped cause Australia’s wettest November on record and its coolest in 22 years. It was also a month of below-average solar and wind power for parts of southern and eastern Australia.
The map below shows the surface pressure anomaly for November 2021. The map shows a belt of abnormally high pressure to the south of Australia, which forced cold fronts to the south and prevented them from crossing the country’s southern states. There was also a large low pressure anomaly in southeastern Australia, which helped transport moister inland and cause widespread rain across the Murray Darling Basin.

Image: Mean surface air pressure anomaly for November 2021. Source: NOAA
The above air pressure anomalies disrupted wind patterns across Australia in November. The map below shows that wind over southern Australia was weaker and more easterly than usual. This caused lower-than-average wind power generation in parts of southern Australia during late spring.
By contrast, abnormally strong northerly winds helped transport tropical moisture over eastern and southeastern Australia, which caused widespread and heavy rain.

Image: Mean 850 hPa wind vector anomaly for November 2021. Source: BoM
Looking ahead, the SAM is likely to stay positive until at least early January, which will promote more relatively wet and cool weather in eastern Australia, along with lighter-than-normal winds in the country’s south.

Image: SAM forecast, showing a likely continuation of positive SAM values into the start of the new year (green line). Source: Bureau of Meteorology
The mix of above average rain and cooler-than-average days is likely to help suppress bushfire activity in parts of eastern Australia during the first half of summer. Weatherzone will continue to monitor the SAM throughout summer, for more information please contact us at apac.sales@dtn.com.


