Relentless rainfall has soaked already sodden areas of eastern NSW this week, leading to flooding, road and rail disruptions, and Sydney’s wettest August day in nearly two decades.
A deep stream of moist easterly winds has cause rain to soak parts of NSW and southeast Queensland every day between Monday and Friday this week. Most of these areas were already waterlogged to start the week following an already exceptional wet August across a large are of eastern NSW with a barrage of rain-bearing systems that have not allowed the landscape to drain.
Sydney’s wettest August day in 18 years, and wettest August since 1998
The metropolitan region has been drenched over the course of August 2025, leading to road damage and increased insurance claims, disruptions to public transport and private industries, and increased risk of trees and powerlines toppling from the sodden ground.
Sydney’s official rain and weather observation station, Sydney Observation Hill, recorded 82.4mm in the 24 hours to 9am on Thursday, August 21, 2025 – more than the entire monthly average rainfall for August in a day. The unseasonable deluge, in what is typically the fourth-driest month of the year, meant that:
- It was Sydney’s wettest August day since 2007.
- It was Sydney’s wettest day of 2025 to date.
- It was Sydney’s wettest Day since June 2, 2024, when 142.6mm fell.
- Sydney has now more than quadrupled its average August rainfall of 79.9mm.
- Sydney has now had 17 rain days (with 0.2mm or more) to date this August. The record is 23.
- Sydney has received 1350.0mm of rain this year, which is already more than 100mm above the annual average in records that go back to 1858.
As of 9am Friday, the running monthly rainfall total for Sydney now sits at 368.8mm, making it the fourth wettest August on record (behind 482.6mm in 1998, 470.6mm in 1986, and 378.3mm in 1899), and wettest August since 1998.
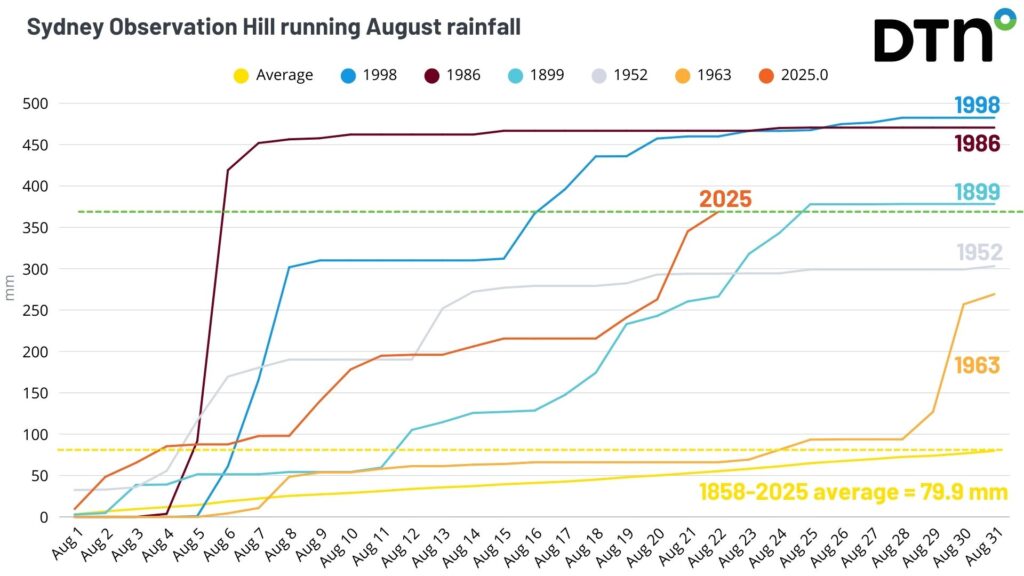
Image: Sydney Observation Hill’s running August rainfall total for 2025 (dark orange), compared to past wettest Augusts on record in 1998 (blue), 1986 (dark purple), 1899 (light blue), 1952 (gray) and 1963 (orange), and the running August average (yellow).
Persistent rainfall across eastern NSW and southeast Queensland
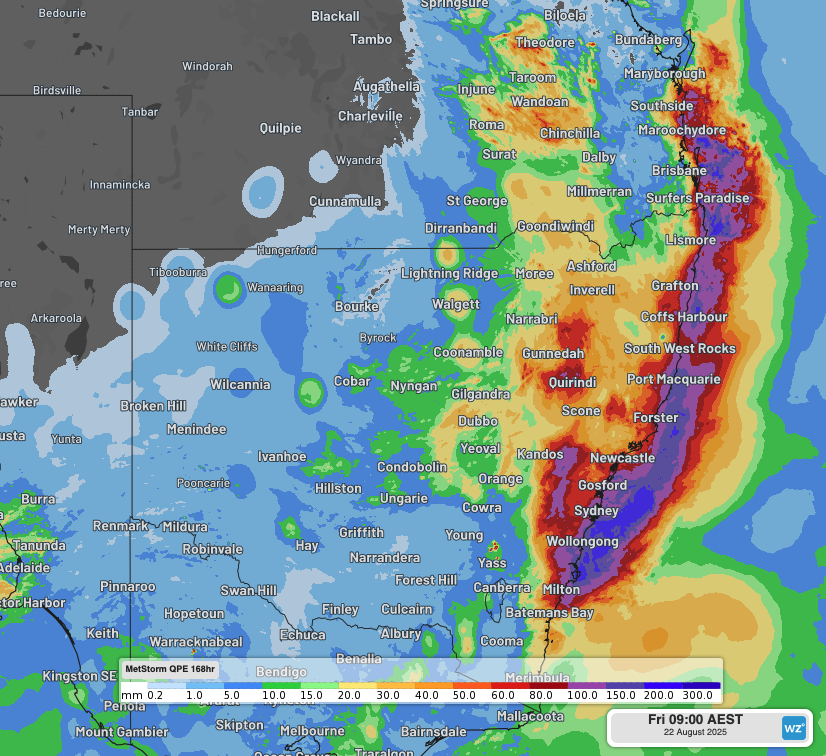
This relentless rainfall has affected much broader areas than Sydney, with widespread rescue efforts and industrial resource deployment across much of eastern NSW and southeast Queensland. Over the past week, widespread falls of 80-120mm have been recorded between K’Gari in southeast Queensland, and Batemans Bay in NSW’s South Coast, with notable rainfall totals to 9am on Friday reaching:
- 280.6mm in 4 days at Jervis Bay’s Point Perpendicular, bringing the monthly total up to 429.6mm, the wettest August on record for the station.
- 234.8mm in 2 days at Port Macquarie, bringing the monthly total for the station up to 368.8mm.
- 140.0mm in 4 days at Norah Head, bringing the monthly total up to 403.8mm, the wettest August on record for the station.

Image: DTN’s Quantitative Precipitation Estimates (QPE) in the week to 9am on Friday, August 22, 2025, across eastern NSW and southeast Queensland.
As indicated by the heavy rain near Tamworth (where the average August rainfall is just under 40mm), this event is remarkable not just for the heavy August rainfall on the coast and nearby ranges, but for how far the heavy rain has pushed inland.
Indeed the only major flood warning currently in place on Friday morning for NSW is for the Namoi River, which flows through the North West Slopes and Plains forecast district, west of the Great Divide.
However numerous flood watches and minor flood warnings are in place across the Metropolitan, Hunter, Mid North Coast and North West Slopes regions, disrupting road and rail transport industries.
Why is it raining so much in NSW?
A broad strong high pressure system centered over the lower Tasman Sea is pushing moisture-laden air onshore from the east into NSW. That saturated airmass is interacting with a persistent coastal trough and near-stationary upper-level low to generate frequent heavy showers and periods of rain. This high pressure is also much further south than usual for late winter, as seen in the shades of red (high than normal pressure) in the map below.
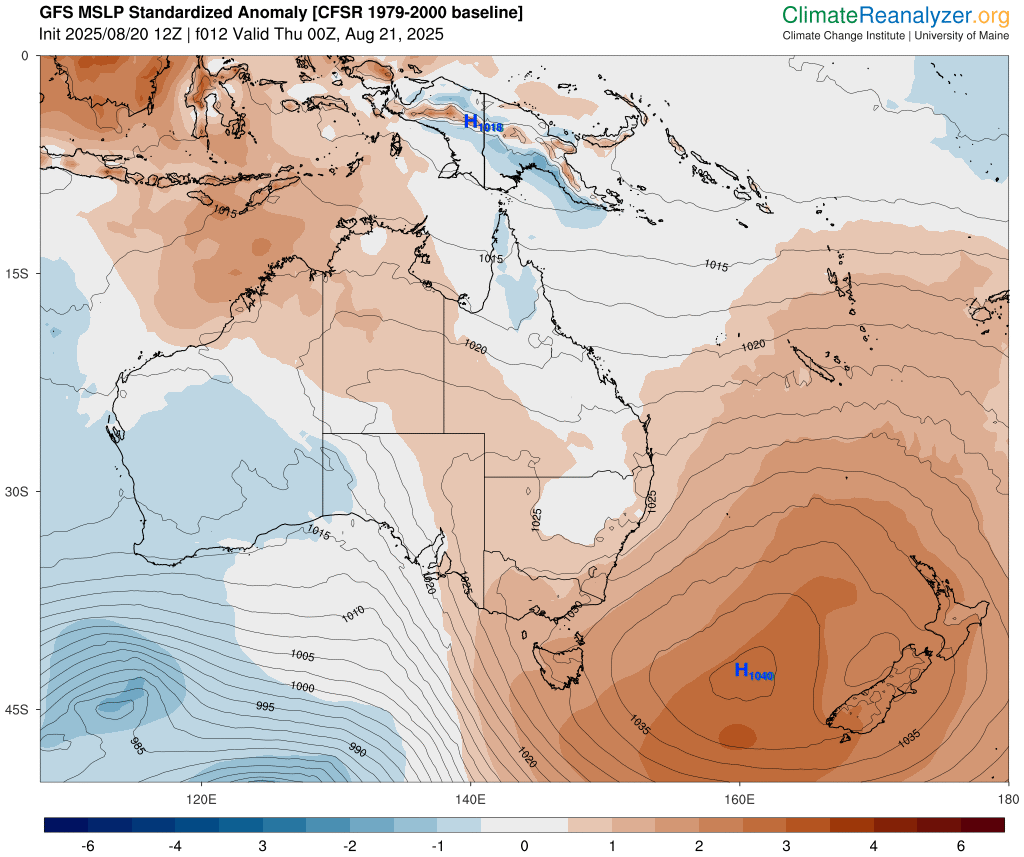
Image: Mean Sea Level Pressure (MSLP) isobars and MSLP anomaly shadings for 8pm on Thursday, August 21, 2025. Source: ClimateReanalyzer.org
This higher than normal pressure across the Tasman Sea can be attributed to a period of positive Southern Annular Mode (SAM), which promotes increased high pressure around southern Australia’s latitudes and increased onshore easterly winds into eastern Australia.
Read more about a recent positive SAM event and it’s impacts across Australia: Positive Southern Annular Mode emerging – here’s what it means for Australian businesses
Recent positive SAM phases have combined with unusually warm sea surface temperatures off the NSW coast to fuel back-to-back heavy rainfall events across eastern NSW in recent weeks and months.
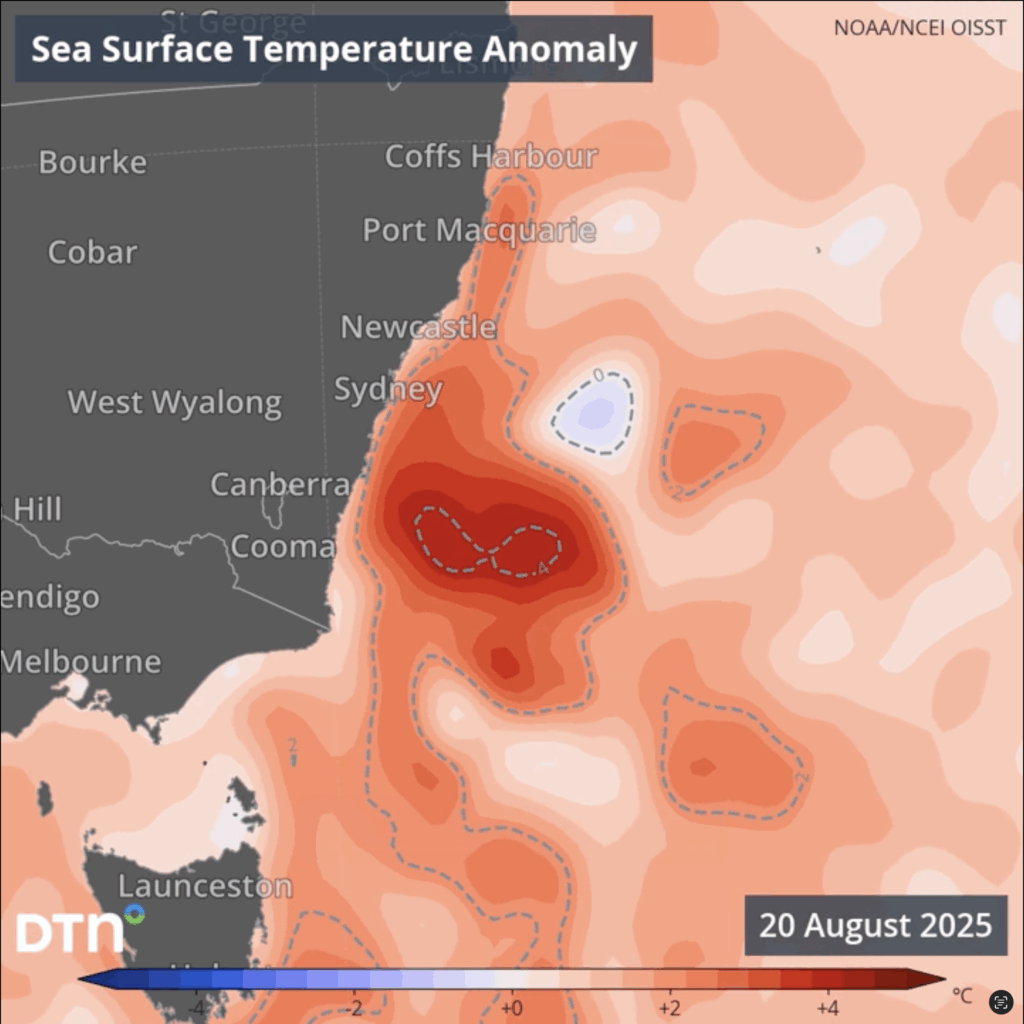
Image: Sea surface temperature anomalies off the NSW coast, with the darkest red areas showing water that is over 4°C warmer than usual for this time of year.
The map above shows sea surface temperature anomalies (temperature difference from the long-term average) for the NSW coastline on August 20. A large red blob of extremely warm water for winter lies just southeast of Sydney. And if you look at the video loop below, you can see that sea surface temperatures have been relatively warm all winter, with the warmth anomaly increasing in recent weeks.
These NSW sea surface temperatures are in the top 10% of historical records.
Video: Animated loop showing sea surface temperature anomalies off the NSW coast from the start of winter 2025 to August 20.
Abnormally warm sea surface temperatures help provide moisture in the atmosphere, because the rate of evaporation is higher with warmer water.
The East Australia Current – which feeds water in a general southwards direction along Australia’s east coast – has been warmer than average for much of past few years. While the current runs less strongly in winter than summer, it is still largely responsible for the warm water off the NSW coast.
Looking at the bigger picture, the underlying effects of climate change are a key factor behind warmer sea surface temperatures across much of the globe, with the oceans absorbing up to 90% of the heat generated by increasing greenhouse gases.
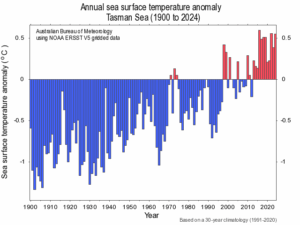
Image: Tasman Sea sea surface temperature anomalies from 1900 to 2024. Source: BoM.
As the image above shows, the Tasman Sea has been considerably warmer than the long-term average most years since the turn of the millennium.
A dry end to August on the way for eastern NSW
A few heavier showers will persist on Friday, mostly between Port Macquarie and Wollongong, with much lighter coastal showers extending into the weekend. From next week, southeastern Australia will begin to be dominated by a more westerly wind pattern as a series of cold fronts cross the south of the country.
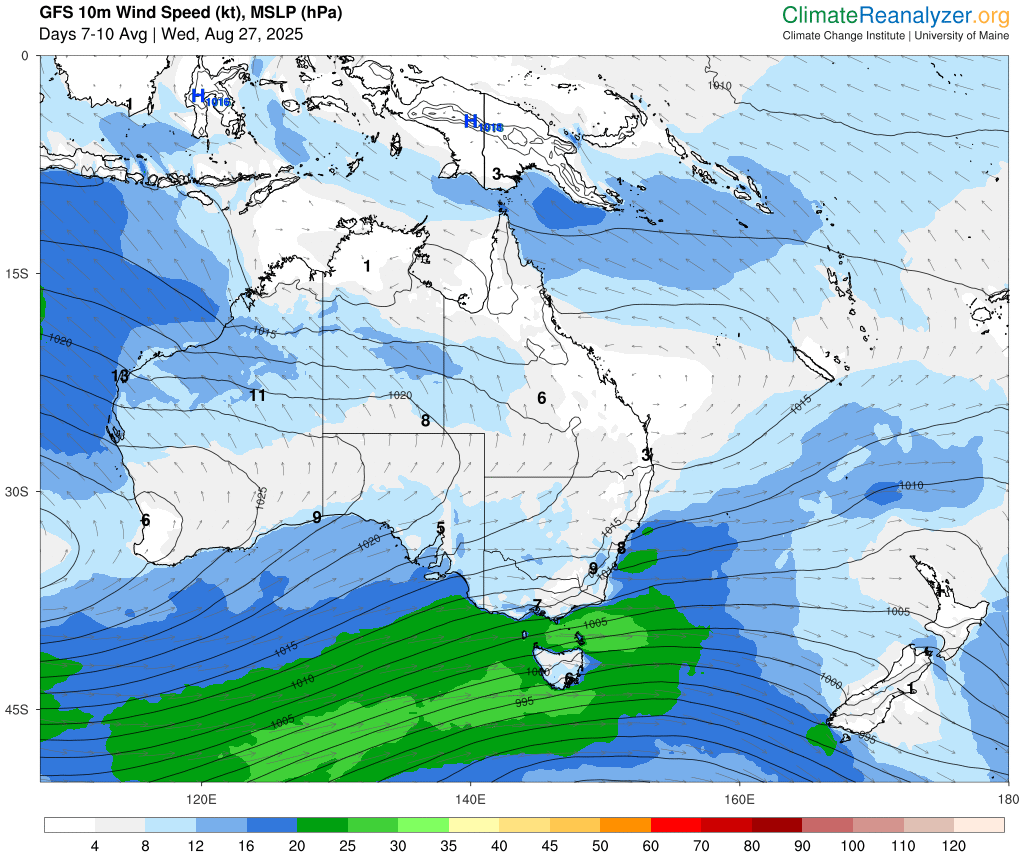
Image: Mean Sea Level Pressure (MSLP) and 10m wind speeds in the 3-day period starting Wednesday, August 27, 2025. Source: ClimateReanalyzer.org
A few showers are possible around the mid-to-late week period next week, but westerly winds usually precipitate most of their moisture west of the divide, leaving little rainfall for eastern NSW. While the relief from the rainfall will be welcomed across NSW’s many industries, strong and gusty winds combined with the sodden ground from all the rainfall will bring a heightened risk of trees and powerlines toppling across roads, rail and power networks.
How DTN APAC Risk Communicators can help during severe weather
DTN APAC specialises in industry-leading forecast, alerting and threat analysis of severe weather across Australia and Asia, offering you expert, customised solutions when the weather turns wild.
You will have the most precise weather intelligence charting rainfall, wind speeds and potential flooding to help you make critical decisions quickly. Whether it’s adjusting key work schedules, protecting your staff or securing your site, we have the alerting capability to keep you steps ahead of the storm.
As the climate delivers increasingly severe weather events, their potential to impact your business operations grows.
Whether it’s preparing for the coming season, or rapid-response forecasting with flooding inbound, or simply ensuring your operations team is equipped to confidently make decisions ahead of severe weather, our weather Risk Communicators are here for you.
Our weather risk communicators deliver short- to long-term guidance from:
- hourly-event weather monitoring (alerting you of impending deluges, river flooding and damaging winds).
- week to month operational planning based on likely timing of increased flooding rain or periods of more settled weather for remedial works.
- seasonal long term planning based on climate drivers and the likely trends across the coming months.
We deliver clear and comprehensive weather data, personalised risk assessments and briefings to you and your team, so that your critical decisions can be made with confidence.
We are available 365 days a year, so you always have the timely guidance you require, especially when severe conditions hit.
You have our insights to rely on to see you through complex situations, minimising potential loss of profit and maximising the safety of your staff and assets.
Learn more about our large range of industry leading products and services or email us at sales.apac@dtn.com


