
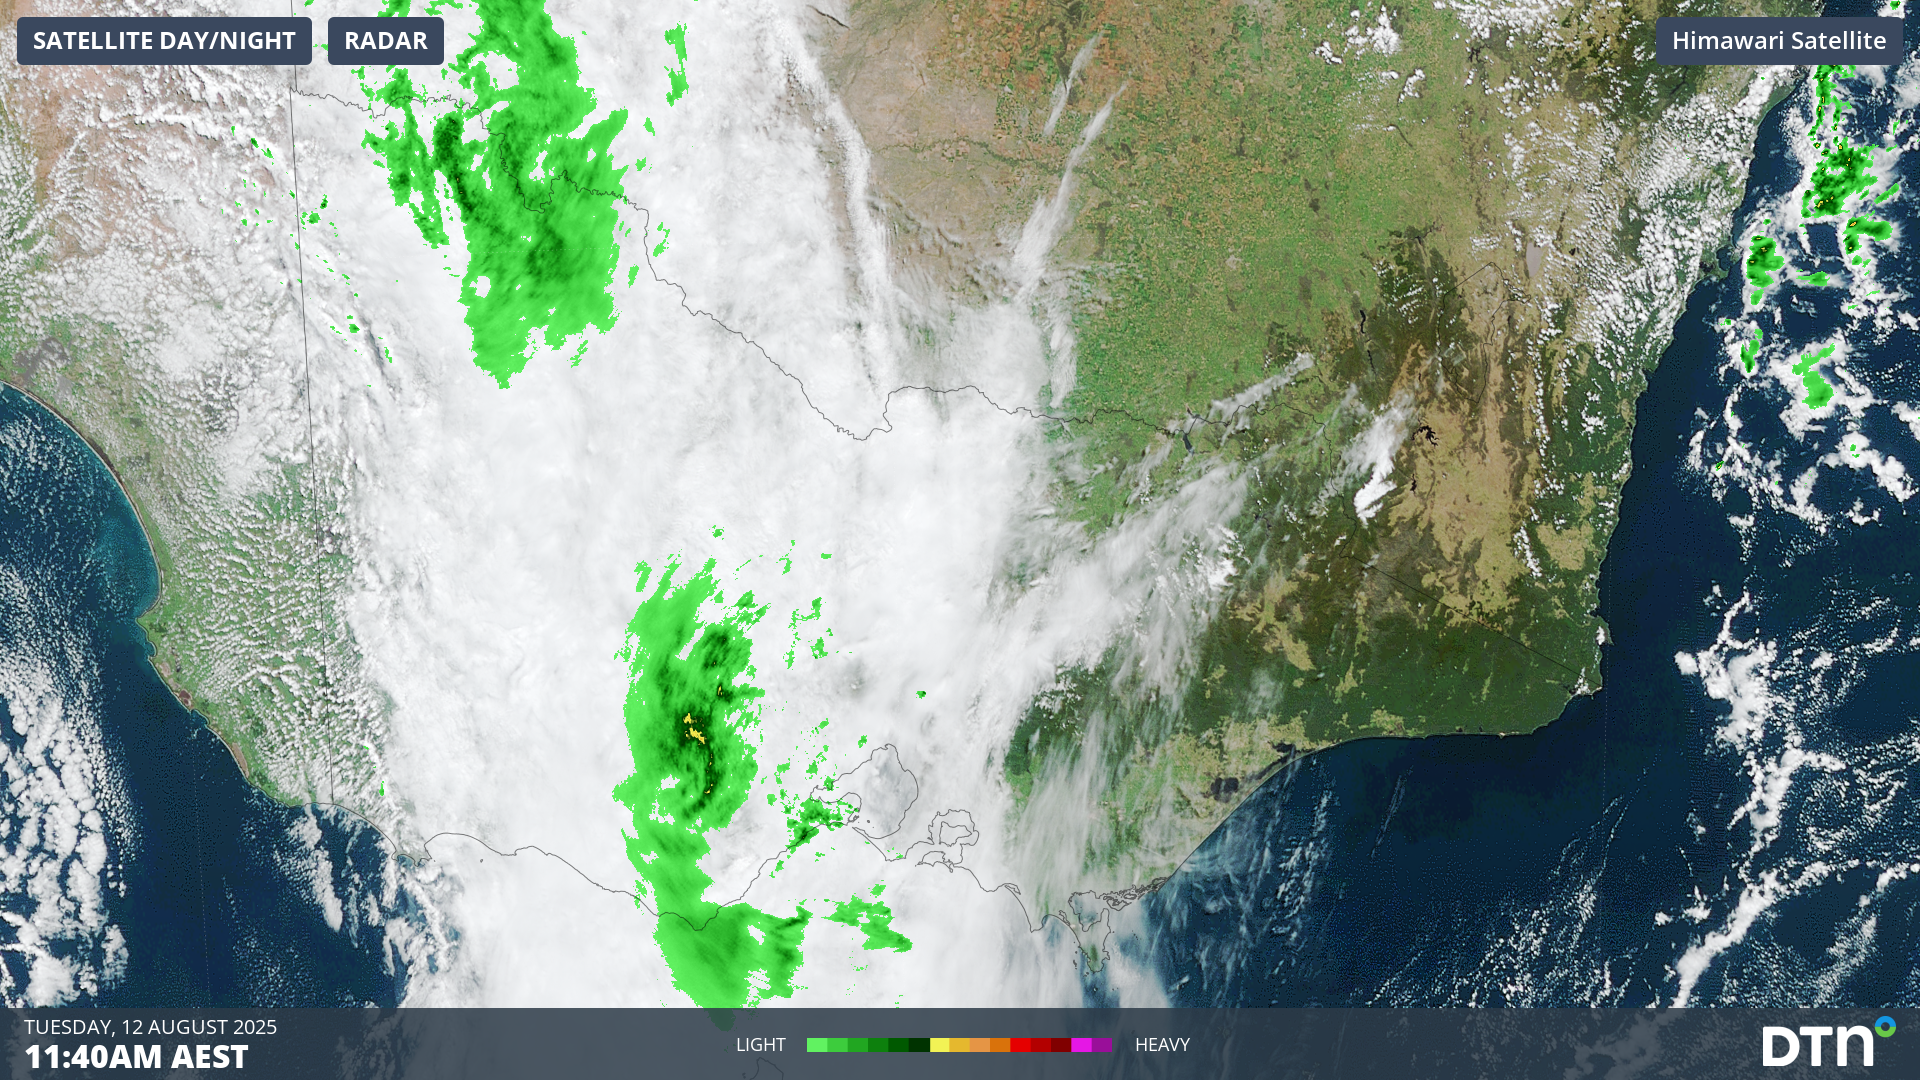
A rainband associated with a cold front stretches the full length of Victoria from north to south as it crosses the state this Tuesday, bringing welcome moisture to agricultural and forestry industries that rely heavily on winter rainfall.
Winter is the wettest time of year in most parts of Victoria, Australia’s southernmost mainland state, and it has delivered so far in most forecast districts.
Video: Three-hour combined radar and satellite loop showing the rainband crossing Victoria on Tuesday, August 12, 2025.
Victorian towns and cities (and the forecast districts in which they’re located) that saw ABOVE-AVERAGE rainfall in the first two months of winter 2025 include:
- Hamilton (South West) 148.2mm. The combined average for June and July is 138.7mm.
- Echuca (Northern Country) 110.5mm. The combined average for June and July is 83.6mm.
- Ballarat (Central) 150.6mm. The combined average for June and July is 128.8mm.
- Orbost (East Gippsland) 146mm. The combined average for June and July is 144.8mm.
- Falls Creek (North East) 273mm. The combined average for June and July is 247.5mm
The list above features towns and cities spread across different parts of Victoria, illustrating that the first two months of winter 2025 generally were healthy for rainfall in most areas.
While Melbourne’s total of 93.6mm was statistically less than average for June and July, it was only 1.9mm below average.
But August has been very dry across southern Australia so far. While we’re only 12 days into the month, every drop will count in systems like today’s rainband as we near the end of winter.
Remember that much of southeast South Australia, western Victoria and Tasmania have endured longstanding rainfall deficits that stretch back to the start of 2024 and in some cases much earlier. So even if they’re on par for winter rainfall to date, more rain is welcome.
For example, the Mallee city of Mildura was very close to its combined rainfall average in June and July. But for the year as a whole, it had seen just a paltry 74.9mm of rainfall (before it received 2.4mm to 9am this Tuesday). That’s less than half its running annual average.
How DTN APAC helps agricultural and forestry plan for the next season
The shifting climate is bringing increased complexity and greater risks to businesses worldwide. We are here for you, delivering trusted weather solutions to optimize your operations and profitability.
DTN APAC is a diverse team, with global forecasting, product development and analytics expertise. Couple this with extensive industry experience spanning Aviation to Energy, and we are primed to assist you in strengthening your response to weather impact.
We work hard to identify your operational pressures and tailor our services and products to meet your needs. Concise communication, giving you full situational awareness exactly when you need it, is our focus. We want to reduce weather risk in your operations, every day.
We deliver clear and comprehensive weather data that you can’t get anywhere else, personalised risk assessments and briefings to you and your team, so that your critical decisions can be made with confidence.

We are available 365 days a year, so you always have the timely guidance you require, especially when severe conditions hit.
You have our insights to rely on to see you through complex situations, minimising potential loss of profit and maximising the safety of your staff and assets.
Learn more about our large range of industry leading products and services or email us at sales.apac@dtn.com




