The La Niña that just helped deliver Sydney’s wettest start to a year on record is struggling to break down in the Pacific Ocean, suggesting it may last longer than some forecast models suggest.
The Southern Hemisphere’s autumn is typically when La Niña events decay, allowing the Pacific Ocean to return to a neutral state.
Indeed, this is what most international forecast models expect to happen with the current La Niña, which started in late November last year.
According to the Bureau’s latest Climate Driver Update, “La Niña will ease in strength over the coming months, with a return to neutral ENSO conditions (neither El Niño nor La Niña) most likely in late autumn or early winter.“
However, forecasters at the U.S. National Weather Service’s Climate Prediction Centre (CPC) and Columbia University’s International Research Institute for Climate and Society (IRI) paint a slightly different picture for the fate of La Niña in the coming months.
According to the latest CPC/IRI forecast, La Niña has a 59 percent chance of continuing through the Southern Hemisphere’s winter and a 50 to 55 percent chance of persisting thorough the Southern Hemisphere’s spring.
This outlook, which is a combination of computer modelling and human forecaster interpretation, firmly puts La Niña at a higher chance than El Niño or neutral conditions (neither La Niña nor El Niño) as we head into the second half of this year.
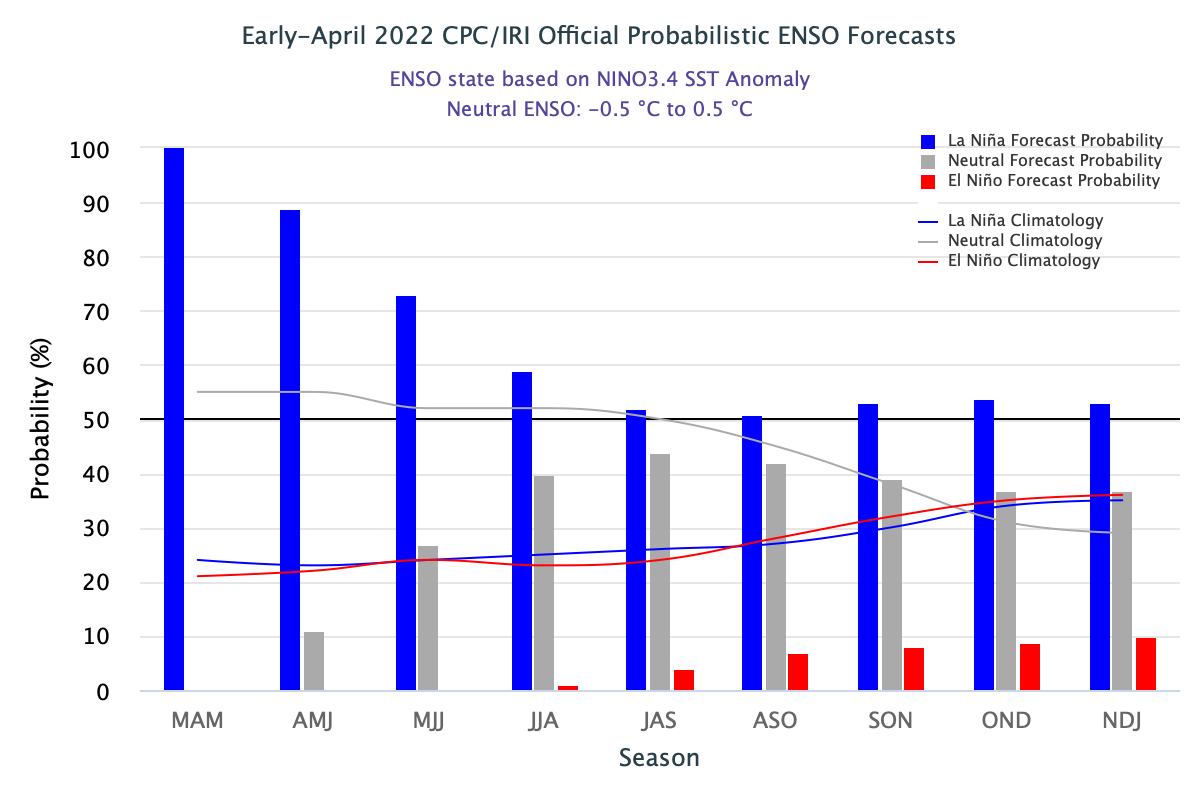
Image: CPC/IRI forecast showing the probability of La Niña, El Niño and neutral conditions (neither La Niña nor El Niño) in the next nine months. Source: CPC/IRI
It is important to note that forecasting La Niña is difficult at this time of year because computer models have less accuracy during the Southern Hemisphere’s autumn. These models typically become more reliable in winter and spring.
But despite the shortcoming of forecast models at this time of year, we do know from observations that La Niña has remained unusually strong in recent weeks.
Two of the key indices that we use to monitor La Niña are:
- Niño-3.4 temperature – the sea surface temperature anomaly in the central equatorial Pacific Ocean. Sustained negative Niño-3.4 anomalies (unusually cool) indicate La Niña conditions.
- Southern Oscillation Index (SOI) – calculated from the air pressure difference between Tahiti and Darwin. Sustained positive SOI values indicate La Niña.
According to the U.S. Climate Prediction Centre, last month’s Nino-3.4 value was the 6th most negative March anomaly since 1950 and the lowest for March since 2008.
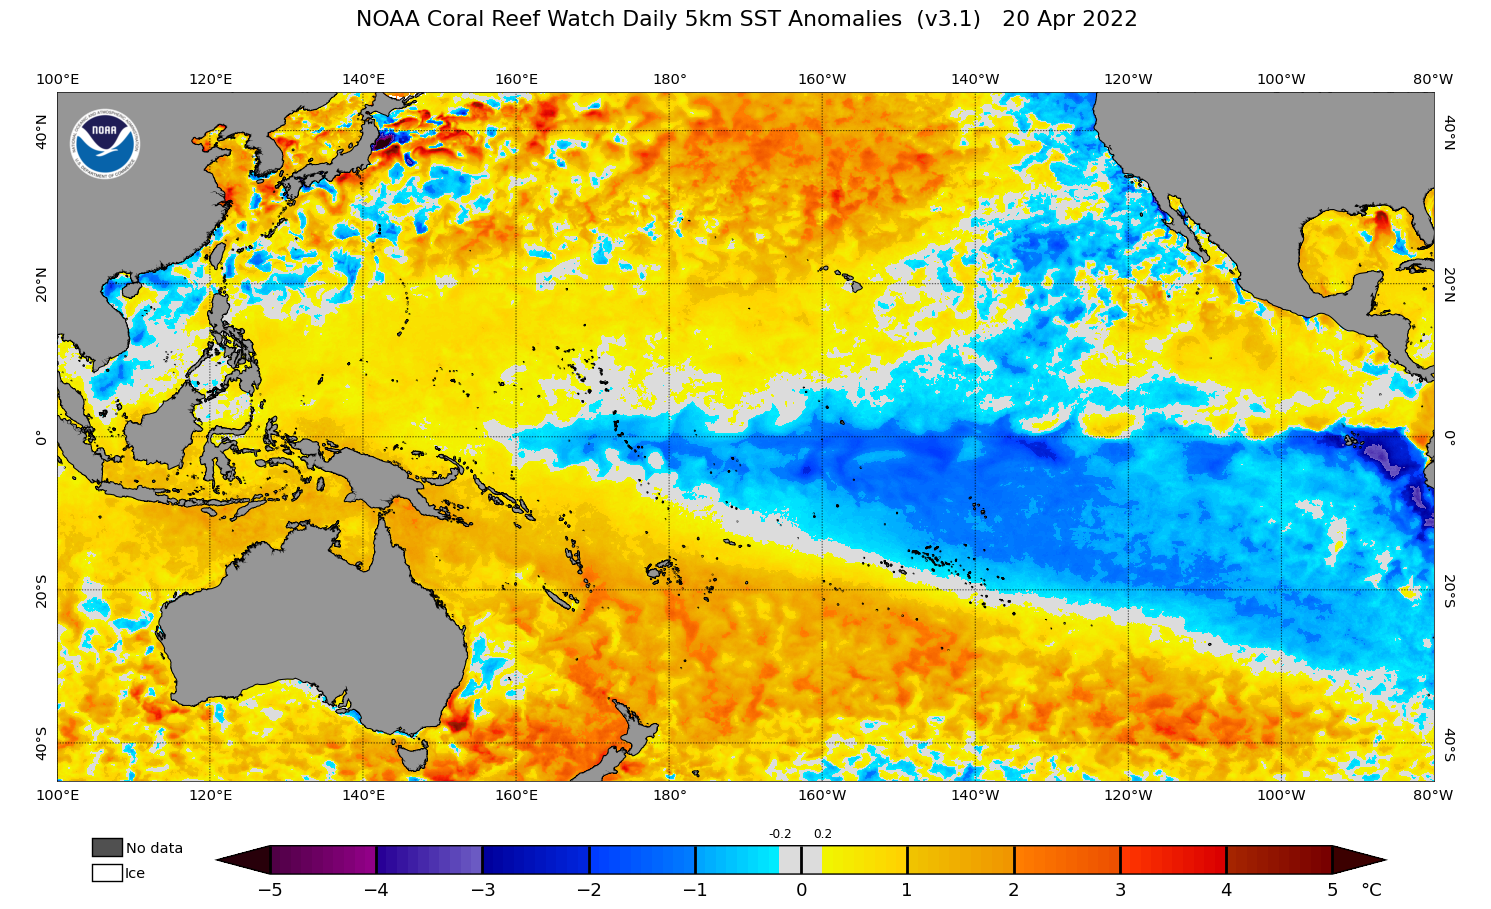
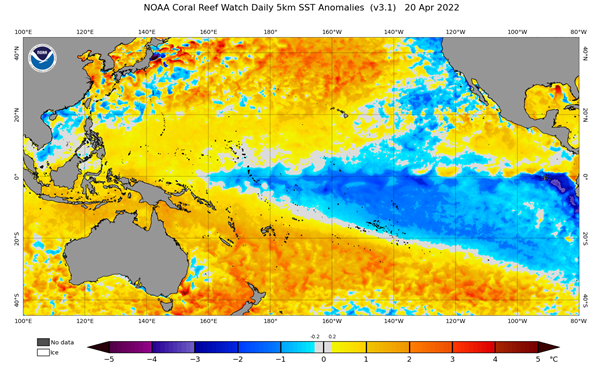
Image: Current sea surface temperature anomalies in the Pacific Ocean, showing a distinctive La Niña pattern with cooler-than-average water in the central and eastern equatorial Pacific Ocean and warmer-than-average water in the western equatorial Pacific Ocean. Source: NOAA
Meanwhile, last month’s SOI value was +13.8ºC. According to data published by the Bureau of Meteorology, this is the highest March SOI value since 2011.
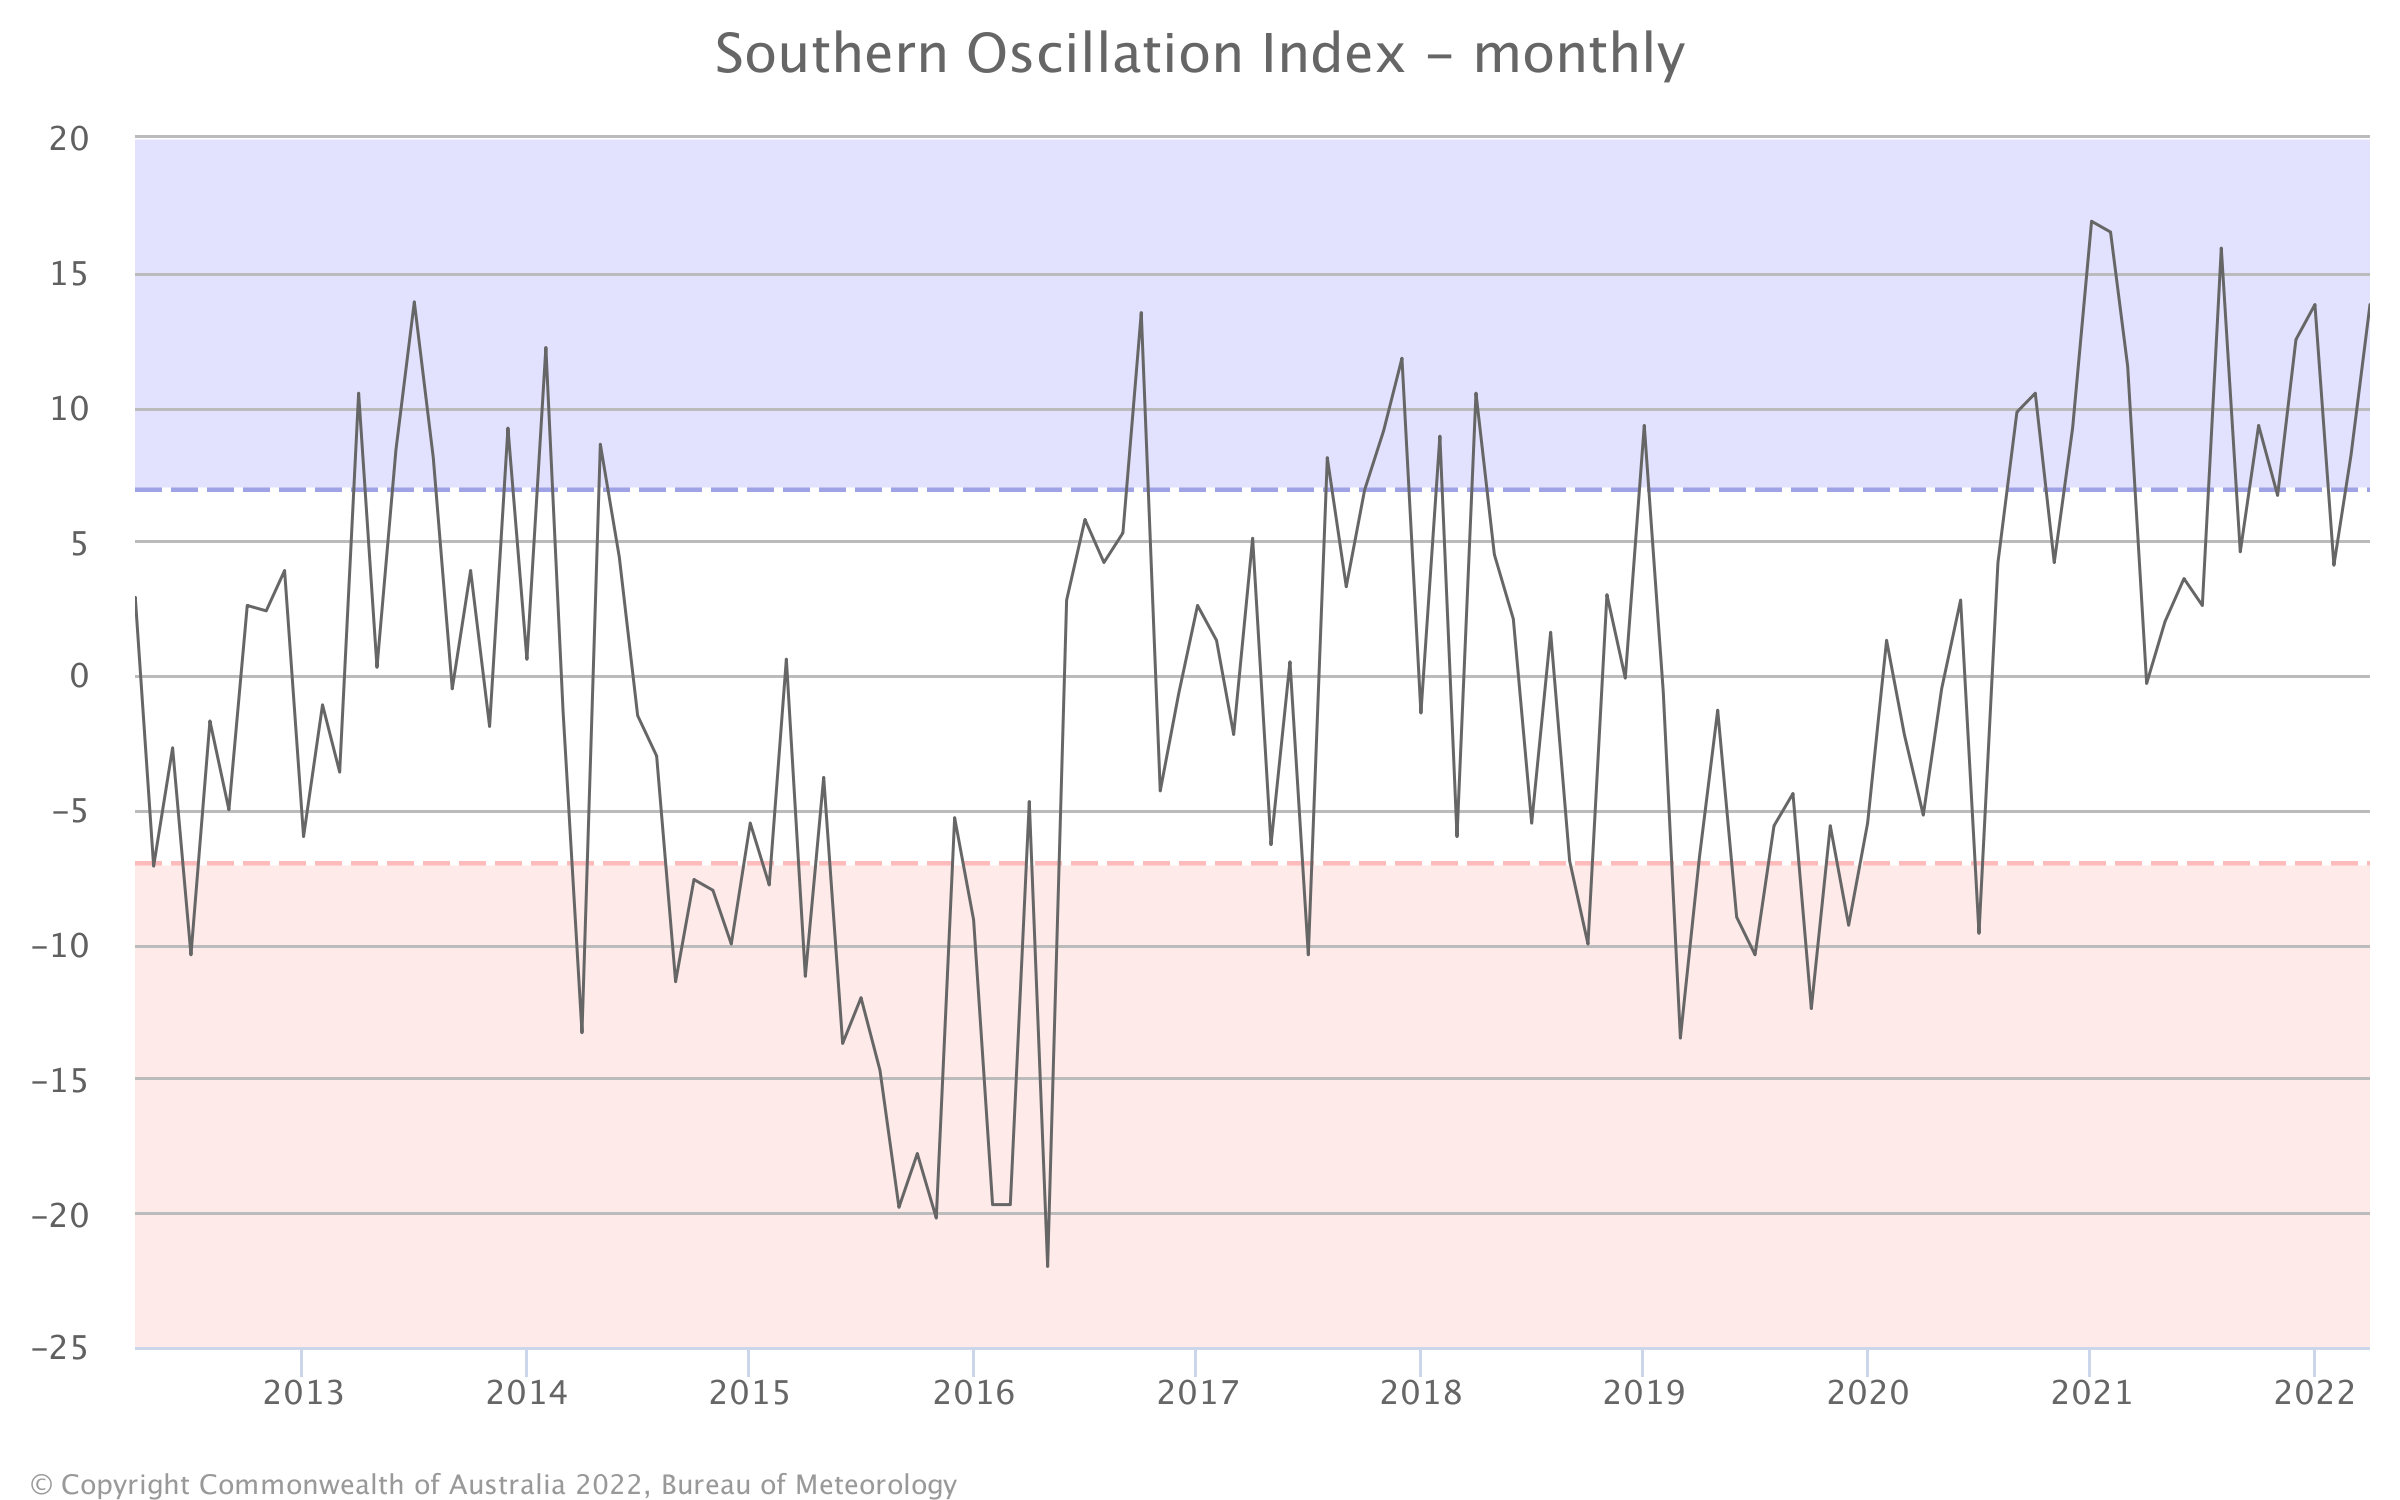
Image: Monthly Southern Oscillation Index (SOI) values over the past decade. The latest value in this graph shows a strong positive anomaly in March 2022 as La Niña persists in the Pacific Ocean. Source: Bureau of Meteorology
It is rare for the footprint of La Niña to still be so well established in both the ocean and the atmosphere at this time of year.
The enduring strength of this current La Niña is something to keep an eye on in the coming weeks and months. As we head into the Southern Hemisphere winter, we should start to get a better idea of whether La Niña is going to be sticking around for a third consecutive year. For more information on Weatherzone’s seasonal forecasts, please contact us at apac.sales@dtn.com.


