A powerful tornado that tore through the town of Greenfield, Iowa last month produced some of the strongest winds ever observed on Earth, according to new data.
Iowa was pummelled by a flurry of severe thunderstorms and tornadoes during an outbreak of violent weather on May 21, 2024. The video below shows the line of severe storms passing over Iowa from west to east last month.
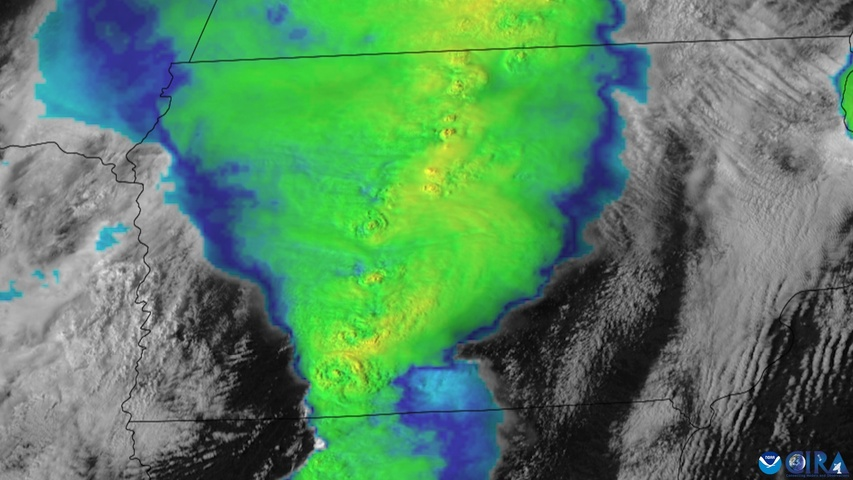
Video: GOES-16 visible satellite and lightning flash imagery showing a line of thunderstorms passing over Iowa on May 21, 2024. Source: CSU/CIRA & NOAA
According to post-event storm surveys carried out by the US National Weather Service (NWS), the strongest tornado from this outbreak, which impacted the town of Greenfield and surrounding areas, caused damage that was consistent with an EF-4 rating.
An EF-4 rating is the second highest category on the six-tiered Enhanced Fujita (EF) scale used for classifying tornadoes, based on the damage caused by the tornado. EF-4 tornadoes typically have peak wind speeds of 116 to 200 mph (187 to 322 km/h).
The NWS estimated a peak wind speed of 175 to 185 mph (282 to 298 km/h) from the Greenfield tornado on May 21. This was based on damage “located within the community of Greenfield and across rural portions of southern Adair County.”
However, the NWS event report for the Greenfield tornado also noted that “additional analysis of data will occur through the coming days and weeks, so further refinement of the tornado statistics are (sic) possible.”
STRONGEST #TORNADO IN HISTORY? 300+ mph wind confirmed in Greenfield, Iowa tornado. Check out this new drone footage from this prior to this measurement! WATCH: https://t.co/hIgQ4RVSws pic.twitter.com/g4m5QmBFec
— Reed Timmer, PhD (@ReedTimmerUSA) June 23, 2024
Video: Drone footage of the Greenfield tornado, captured by storm chaser Reed Timmer on May 21, 2024.
One additional source of data that has emerged since the event suggests that wind speeds inside the Greenfield tornado may have been much stronger than the NWS estimate, at times exceeding 300 mph (483 km/h). This was likely due to the subvorticies that can be seen clearly in the video above.
A doppler on wheels (DOW) mobile radar operated by the University of Illinois collected data suggesting wind speeds near the ground reached as high as 309 to 318 mph (497 to 512 km/h) inside the Greenfield tornado on May 21.
Doppler radar measurements have only resulted in peak wind speeds above 300 mph (483 km/h) on two other occasions: the Bridge Creek, Oklahoma tornado in 1999 and the El Reno, Oklahoma tornado in 2013.
Taking tornadic wind measurement uncertainty into account, the wind speeds calculated from the Greenfield tornado are similar to the DOW-derived winds from the Bridge Creek and El Reno events, making it one of the strongest winds ever detected on Earth.
Are you safeguarding your utilities assets and personnel from the threat of increasingly volatile weather?
DTN APAC, a DTN company, offers precise weather intelligence and alerting to protect your utilities network when severe weather, floods and fires threaten.
Over 80% of Australian transmission and distribution networks already rely on our proven nowcasting and forecasting out to 15 days. You can rest assured yours is protected by market-leading analysis. With this foresight you can gain lead time to prepare for possible outages, reduce risk and protect your people and profits.
You will never be left in the dark when conditions suddenly worsen. We deliver reliable, up-to-the-minute weather forecasts and analytical tools that give you the power to enhance your operational management and response to weather risk. Our Total Lightning Network is a globally proven solution that accurately identifies and alerts you to lightning strikes within your defined thresholds, supporting the safety of your team.
Your customisable interface has GIS mapping, showing multiple weather layers over your utilities network and offering full situational awareness. You can quickly recognise any threat to your assets in real time. 24-hour asset monitoring allows you to track lightning, bushfires and other severe weather systems that approach your service territory.
Advanced and actionable analytics allow you to act decisively and improve your planning and outage response strategy. Keep the power on this season with Storm Impact Analytics;
- Understand potential outage risk
- Learn from past events and provide accurate restoration timelines for customers
- Restore power faster by managing response teams
- Gain powerful decision-making support
Utilities that have installed Storm Impact Analytics have reported a 39% increase in customer satisfaction. To find out more, please contact us at apac.sales@dtn.com.


