Sydney’s soggiest August weekend in nearly three decades adds onto an already well above average month of rain as moist onshore winds stream into eastern NSW, with saturated grounds leaving NSW businesses and industries in a vulnerable position.
Video: Radar imagery showing rainfall moving across the metropolitan region on Sunday, August 10, 2025.
A moist south-to-southeasterly airstream has gripped Sydney since Friday evening, delivering periods of heavy rain. Showers moving from over a very warm Tasman Sea onto land brought just over 80 mm of rain last weekend, including:
- 42 mm in the 24 hours to 9am Saturday
- 38.2 mm in the 24 hours to 9am Sunday
- 80.2 mm across both days
- 79.9 mm is Sydney’s average rainfall across August
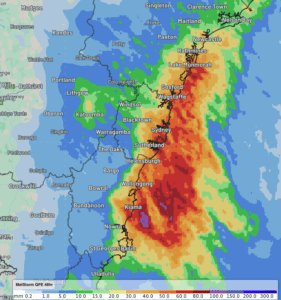
Image: DTN Quantitative Precipitation Estimate (QPE) showing widespread rainfall accumulations of 40-80mm across the greatermetropolitan region on Saturday and Sunday, August 9-10, 2025.
Saturday and Sunday’s rainfall totals make it the wettest August weekend since 1998, when 136 mm fell on Saturday, August 8th, 1998, and 8.2 mm on the following Sunday, for a total of 144.2 mm. It was also the wettest weekend (any month) since the start of June 2024. Unfortunately, this weekend coincided with the City2Surf fun run event, which saw drizzly conditions and slippery road conditions managed by the event coordinators.
Sydney’s wettest start to August since 1998
This weekend’s rainfall (plus 16.6 mm in the 24 hours to 9am on Monday) adds onto nearly 100 mm accumulated in the first 8 days of the month, bringing the total up to 194.8 mm, over double the monthly average. This makes it the wettest first 11 days of August since 1998, and the city’s 5th wettest start to August in 168 years of records.
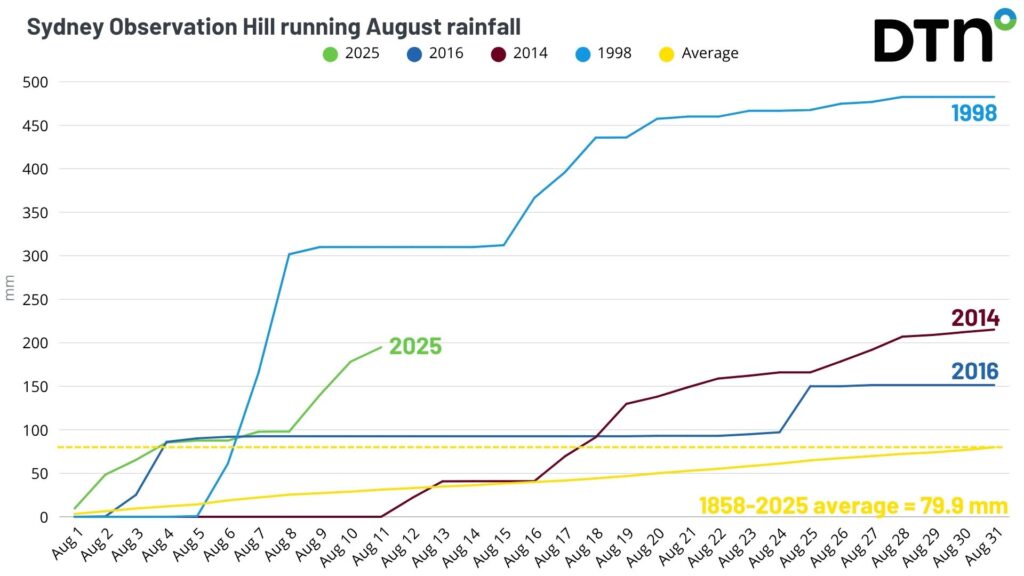
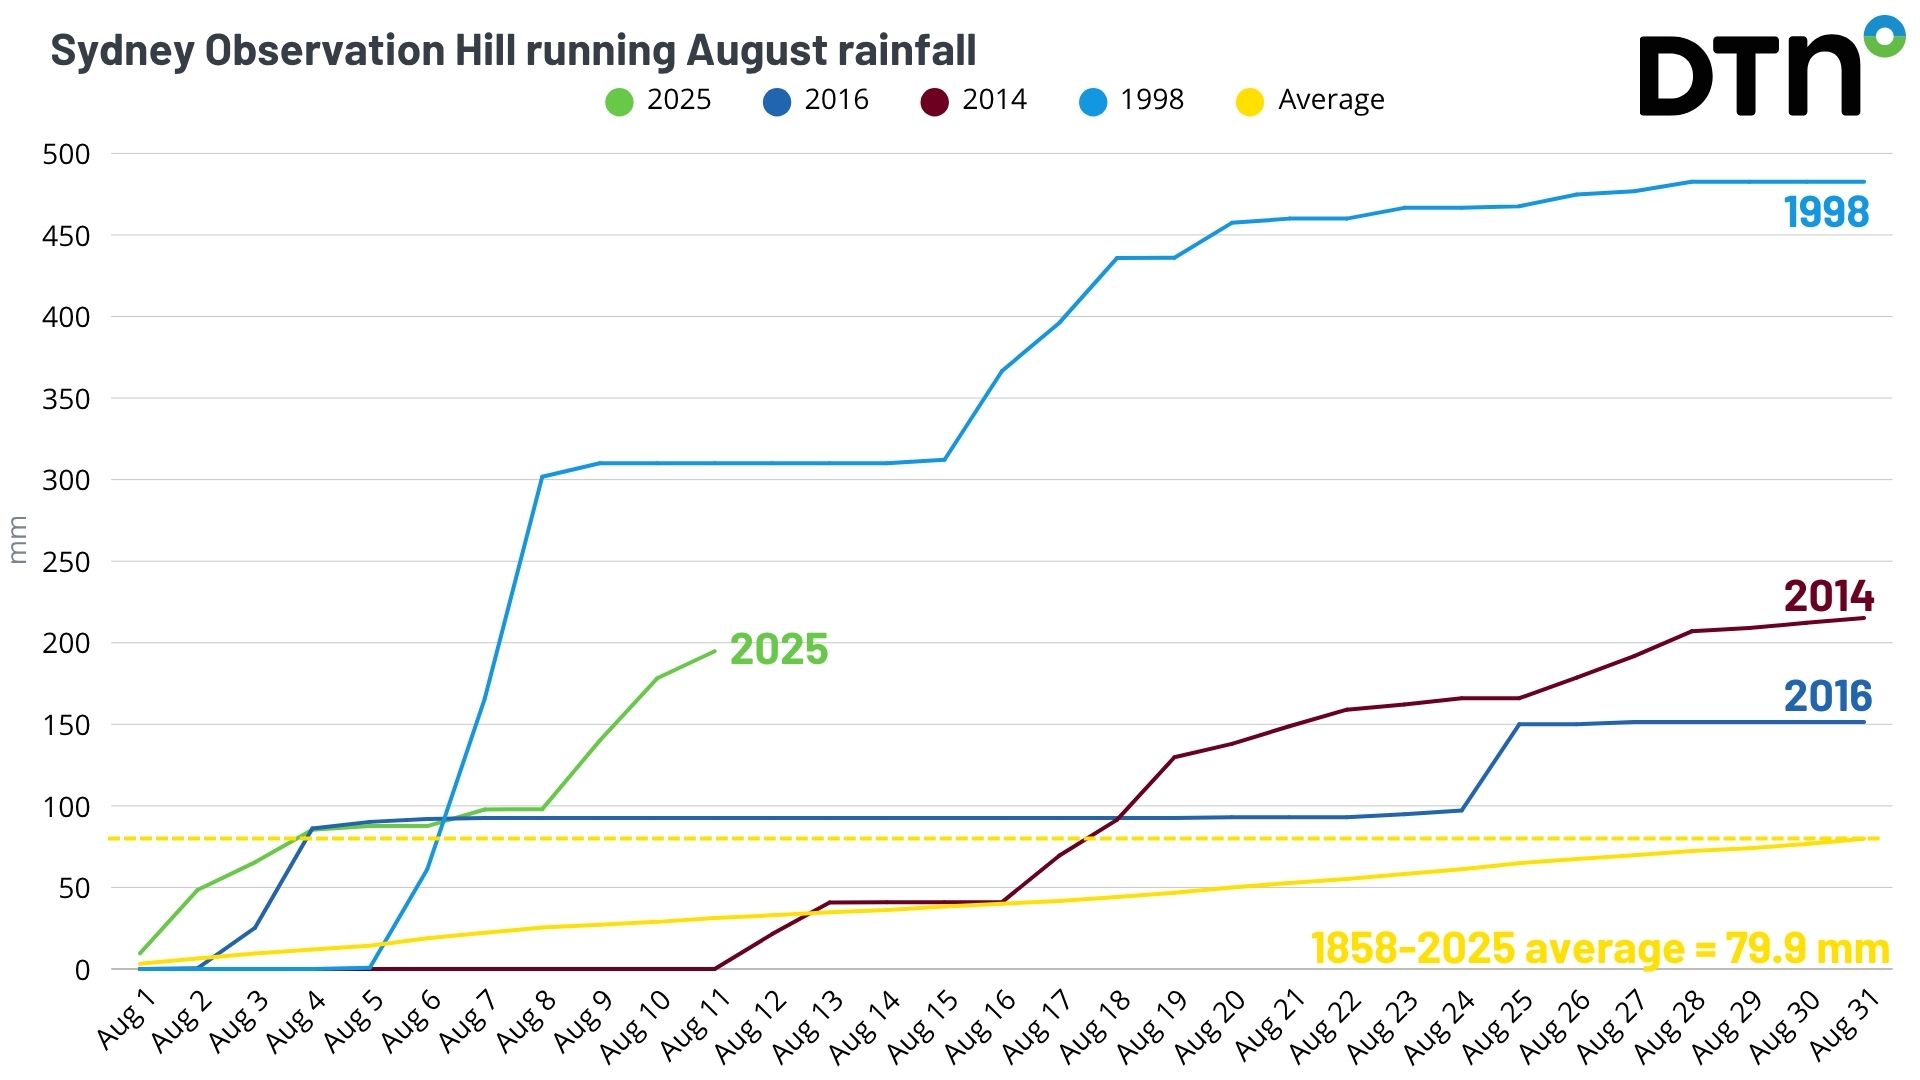
Image: Sydney Observation Hill’s running August rainfall total for 2025 (green), compared to past wet Augusts in 2014 and 2016 (black and dark blue, respectively), the wettest August on record in 1998 (light blue) and the running August average (yellow).
Even only a third into the month, this is already Sydney’s wettest August since 2014 — which saw a total of 215 mm, and the 16th wettest August on record.
Why this intense August rainfall?
As mentioned in Friday’s story, abnormally warm Sea Surface Temperatures (SST) off Sydney’s coastline helped provide increased atmospheric moisture feeding this soggy weekend rainfall. SST off the NSW coast of 19 to 22°C are about 2 to 3°C warmer than average, causing more evaporation over the ocean surface and fueling heavy rainfall.
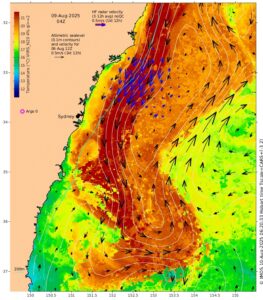
Image: SST off NSW’s coast on Saturday, August 9, 2025, showing a tongue of warm water sitting off the coast. Source: IMOS
These warm SST have been tapped into by persistent onshore winds feeding this August rainfall. A positive Southern Annular Mode (SAM) emerged last week, driving higher than average pressure across southeast Australia and the Tasman Sea, promoting this persistent pattern of moist onshore winds over eastern NSW.
Showery periods should remain over the coming days, although much less intense than the past weekend, with drier conditions returning from Friday. Hints of another positive SAM signal could develop into next week, suggesting the potential for further August rainfall topping up an already very wet month.
How DTN APAC’s unique data sources are helping NSW businesses
We help businesses in Australia, Asia and the Pacific prepare for flooding rainfall and other severe weather, across sectors including Roads and Transportation, Emergency Services, Mining, Insurance and Energy.
Grounds are saturated around Sydney and eastern NSW, leaving businesses and industries vulnerable to flooding, toppling of trees and other weather risk hazards.
Our Long-Range Weather Forecasting spans from 14 day to 12 month forecasts.
These forecasts are produced by our meteorologists using raw data provided by international weather agencies.
These forecasts are produced using a combination of techniques, some in the public domain and others developed by DTN APAC.
Our Risk Communicators can then work closely with you to analyse how weather impacts your operations and communicate potential risks. We can then support your risk management planning, and provide situational awareness and post-event reporting when extreme weather events hit hard.
Find out more about our our large range of industry leading products and services or email us at sales.apac@dtn.com


