Australia was 0.71°C above the long-term average nationwide in June 2024. That made it the fifth of six months to date in 2024 in which average temps across the continent temps were much warmer than usual.
The monthly nationwide mean temperature anomalies across Australia so far this year have been:
- Jan +1.54°C
- Feb +1.71°C
- March +1.11°C
- April -0.51°C
- May + 0.99°C
- June +0.71°C
The map below shows the temperature anomalies (variation from average) for Australia in June, 2024.
Source: BoM.
As you can see, much of Western Australia was warmer than usual – indeed Western Australia as a whole had its eighth-warmest June on record.
But that broad sash of green in eastern Australia shows areas that were up to one degree colder than the long-term average – and there are even tiny islands of darker green where June temps were more than a degree cooler than usual.
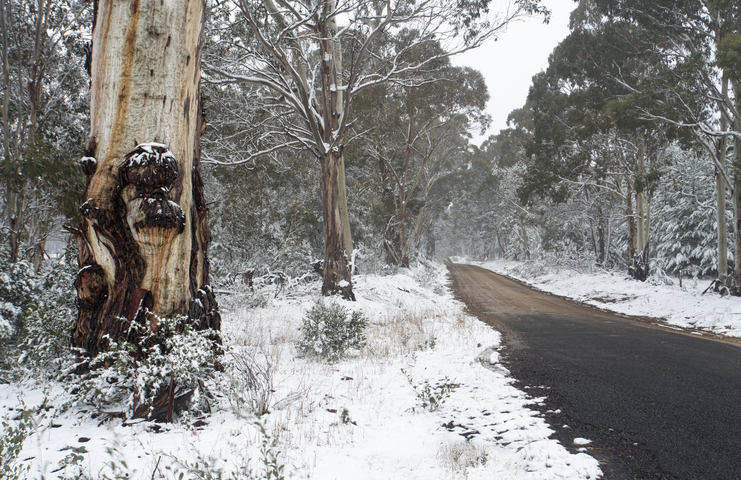
This will ring true for many people in Australia’s most populated corner where June felt decidedly chilly.
- Melbourne was very close to its long-term average minimums and maximums in June 2024. The average min was 6.9°C (long-term average 7°C) and the average max was 14.2°C (long-term average 14.1°C).
- Canberra was cooler than average both by day and night in June 2024. Its average min was of 0.1°C (long term average 1.2°C) and the average max was 12.9°C (long-term average 13.2°C).
- Adelaide days were right on par with an average max of 15.8°C while nights were down by 0.4 on the long-term average of 8.5°C.
- Both Sydney and Hobart were slightly warmer than usual overall, but Hobart is an interesting one as Tasmania as a whole was cooler than the long-term average, with statewide maximums down by 0.27°C and minimums down by 0.17°C.
- Tasmania and New South Wales were the two states where June means temps were lower than average. Victoria was close, with statewide temps just 0.04°C above normal.
In terms of rainfall, the nationwide average was up 9.2% nationwide on the long-term average. As the map below shows, large parts of WA enjoyed a healthy soaking while western Tasmania and a significant chunk of Victoria were two of the areas which were well down on average.
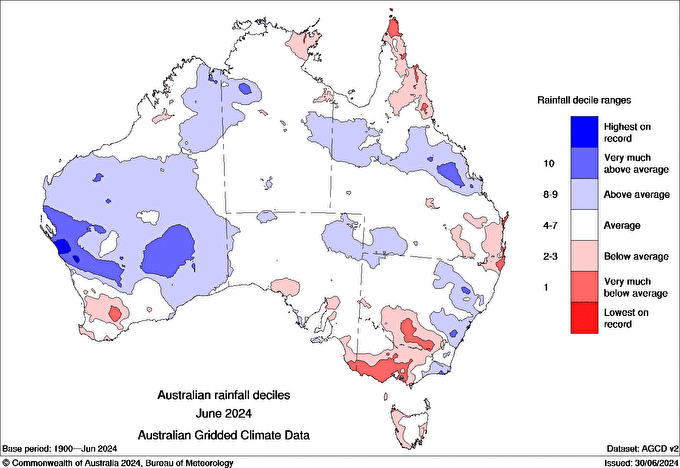
Source: BoM.


