An increasingly reliable and resilient Australian renewable energy network depends on varied and vast sources of energy and accurate and informative forecasting, to meet the increasing energy demand.
The main criticism in the transition to renewable power supplies has come from the dependence on weather and climate to maintain a steady production to meet the power demand. However, Australia’s power supply has countered this disadvantage through several means, including:
- Using varied renewable sources, such as wind, solar, and hydro.
- Using the Australian continent’s vast and varied geography.
- Increasing the usage of big battery banks.
The key to Australia’s uptake in renewable energy has come from variety and strong forecasting. When southern Australia is dry, northern Australia may be wet, or when western Australia is dry, it may be windy or sunny. During times when the sun goes down, or the wind dies down, batteries that have been charging all day can maintain a steady supply.
Australia’s wind energy sector
Until 2008, renewable energy sources only made up as much as 3-7% of the total electricity produced for the National Energy Market (NEM), and most of that came from hydroelectricity in Tasmania, Victoria, NSW and Queensland. These days, the NEM gets around 40% of its power from renewable sources – reducing its dependence on non-renewable power generation with aging infrastructure.
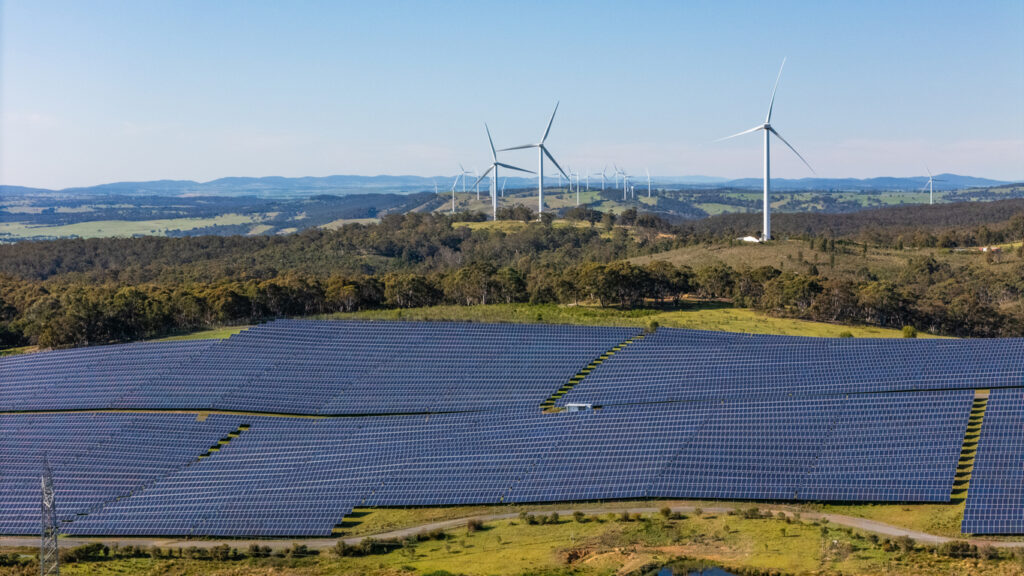
Image: A hybrid solar and wind farm in NSW. Source: iStock / Steven Tritton
Contributions to the NEM from wind energy grew from 1% to about 13% between 2009 and 2024, most coming from South Australia, NSW and Victoria. Recent uptake in wind generation from Queensland and Western Australia has also contributed to an additional 4,900 GWh per year since 2018, about 20% the total wind production of the NEM and Western Energy Market (WEM).
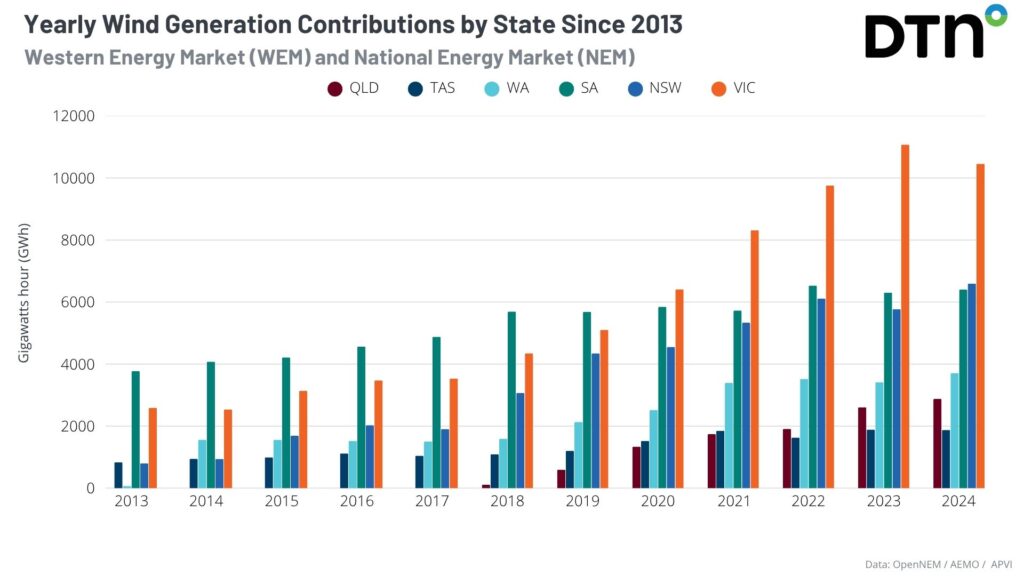
Image: yearly contributions of wind generation by state since 2013. Data source: OpenNEM
South Australia has carried a growing reputation for its renewable energy uptake. As Australia’s driest state, a strong focus on wind since 2007 has seen the state sourcing 40 to 45% of its power from wind farms since 2018. Combined with a steady increase in solar power, the state now sources approximately 70% of its energy from wind and solar energy.
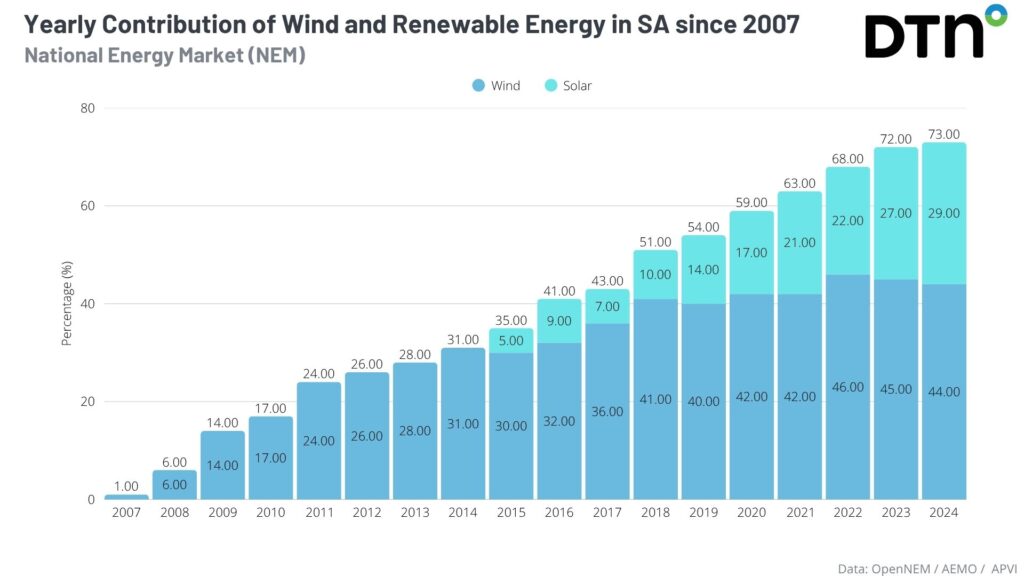
Image: yearly contributions of wind and renewable energy generation by South Australia since 2007. Data source: OpenNEM
However, the renewable energy market is a team sport and rarely will the whole country be voided of wind or sun. If one state cannot power itself, sharing through interstate connectors (inter-connectors), can maintain a steady power supply.
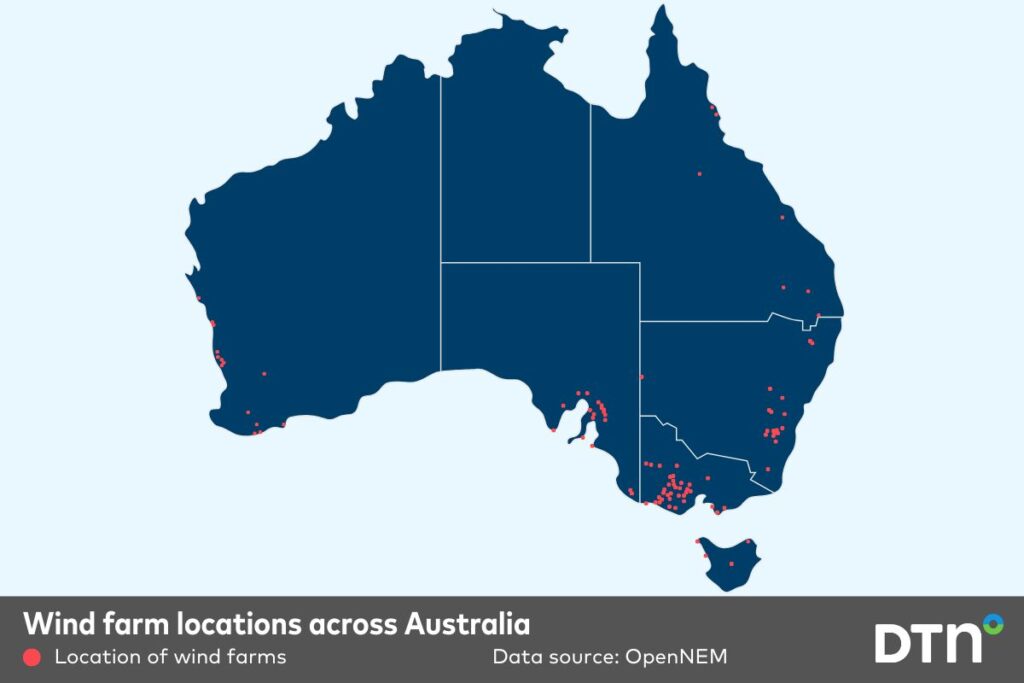
Image: Wind farms locations across Australia. Data source: OpenNEM
How DTN APAC helps the renewable wind energy industry
The past month has seen quite an active spell for wind energy across the NEM. Periods of negative Southern Annular Mode (SAM) during May and June combined with increased electricity demand to bring the greatest 4- and 5-day productions of wind power across the NEM in at least a year, with:
- 720 GWh generated in the 5 days from May 24 to 28
- 620 GWh generated in the 4 days from June 6 to 9
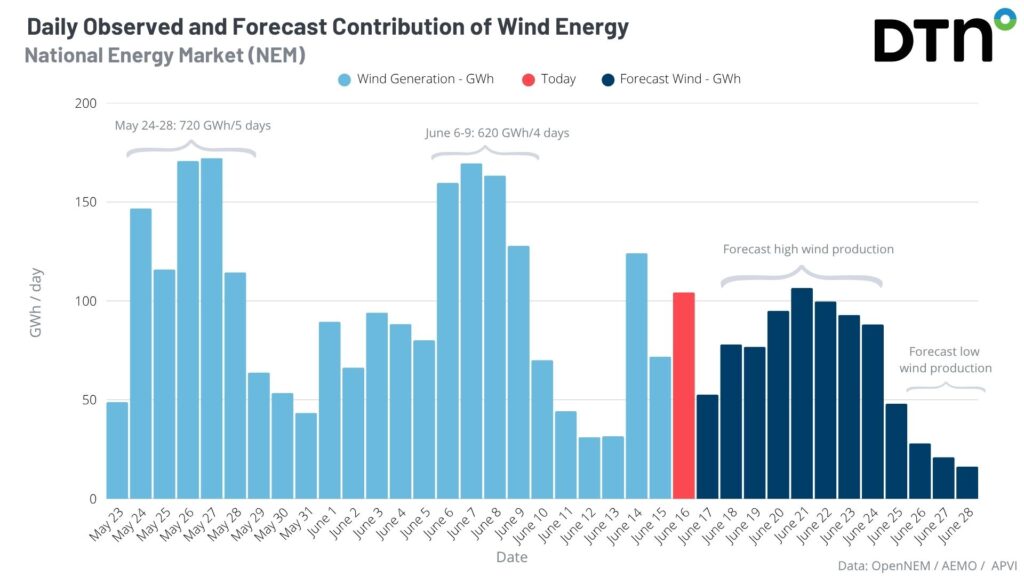
Image: Daily observed and forecast contributions of wind energy. Observations data source: OpenNEM
Some other notable records from the past month included:
- Highest wind generation in Victoria on Monday, May 26, at 8:15pm with 4,206 MW
- Highest wind generation in the NEM on Monday, May 26, at 9:40pm with 9,287 MW
- Highest wind generation in NSW on Monday, May 26, at 11:10pm with 2,343 MW
- Highest wind generation over a calendar month in Queensland during May with 345,813 MWh
- Highest wind generation in South Australia on Friday, June 6, at 7:00pm with 2,165 MW
- Highest wind generation over a day in Victoria on Friday, June 6 with 87,054 MWh
- Highest wind generation in Queensland on Friday, June 13, and Saturday, June 14, with 1,110 and 1,150 MWh, respectively.
- Highest wind generation in Victoria on Monday, June 16, at 6:45pm with 4,220 MW
The above wind energy forecast comes from DTN APAC’s Opticast, which provides wind generation forecasts for individual wind farms, at the state level and for the NEM at daily and hourly resolution out to 14 days. Opticast is an ultra-local forecasting system, independently proven to be the best performing of its type in Australia, allowing you to plan weeks in advance for high or low wind generation across the NEM, your state and/or individual wind farms.

Your customizable Energyzone interface and Weatherguard app will provide access to the Total Lightning Network as well as centralized data from state and territory fire agencies, the Bureau of Meteorology, and over 30 national and international private and state organisations. This enables full situational awareness of weather conditions and fire risk, as well as severe weather alerting via text, email and phone call, so your staff can respond effectively when required. Together we can keep your staff and assets safe, and efficiency high.
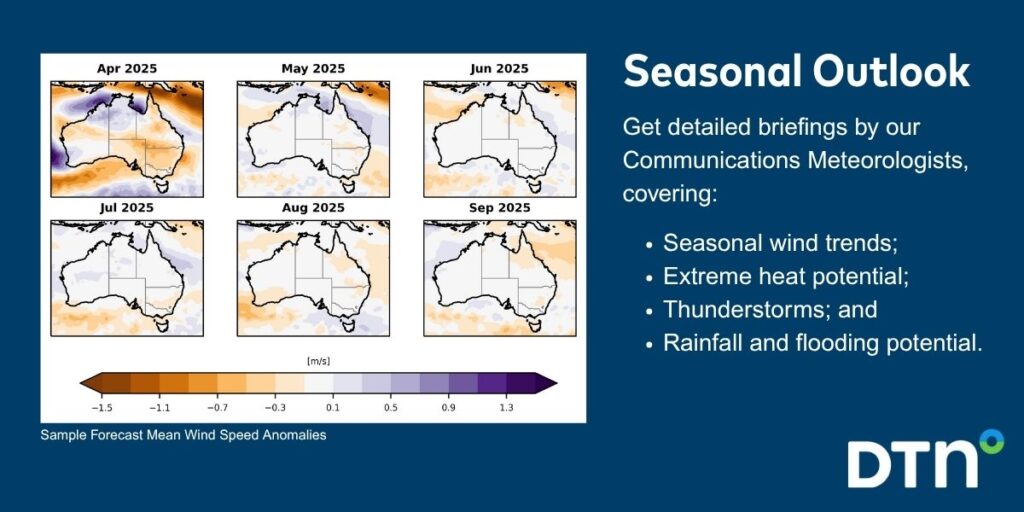
DTN APAC also offers seasonal and long-term outlooks covering wind, rainfall and extreme heat out to 12 months into the future. With renewables making up more of Australia’s energy mix every year, we want to support your business to make informed critical decisions and improve your overall generation and safety.
Learn more about our large range of industry leading products and services or email us at sales.apac@dtn.com
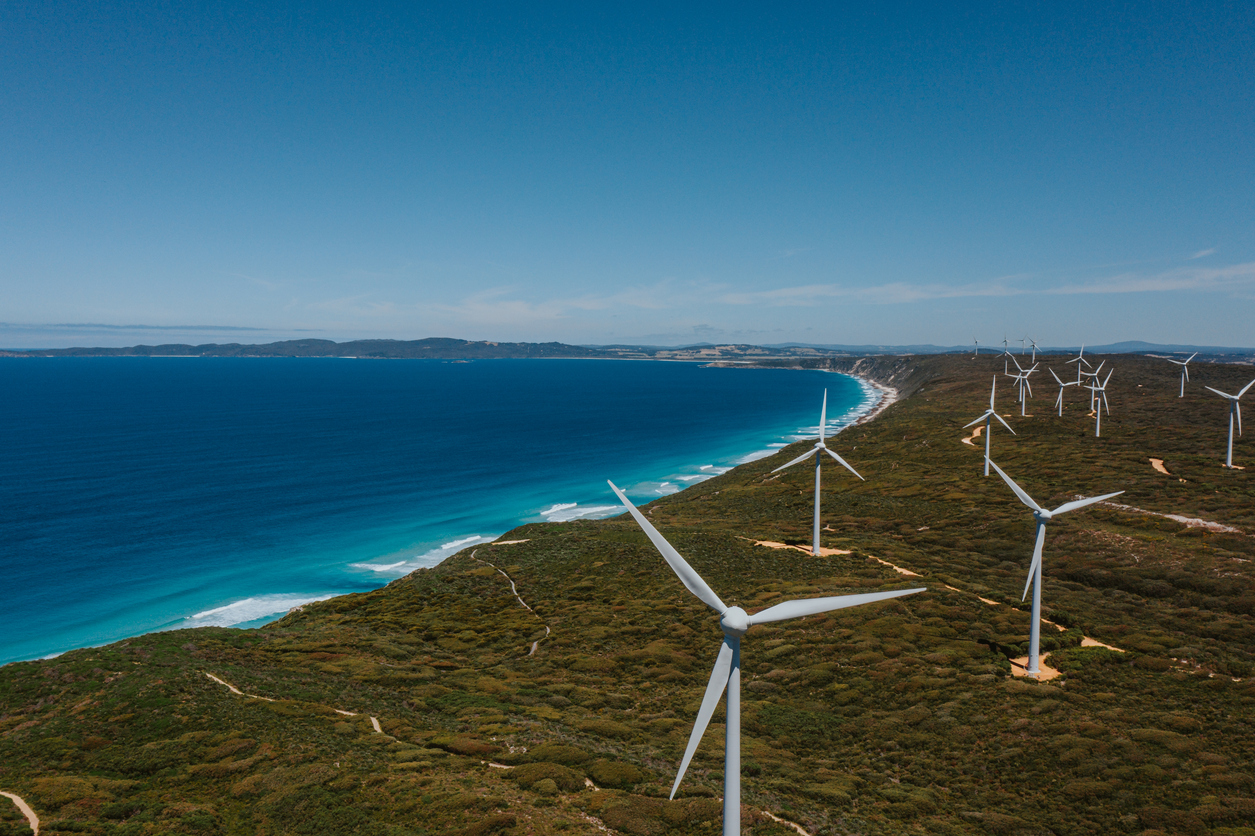
Thumbnail image source: iStock / Shannonstent


