Prosper in a dynamic world
Search

Brisbane’s coldest pair of days in 66 years


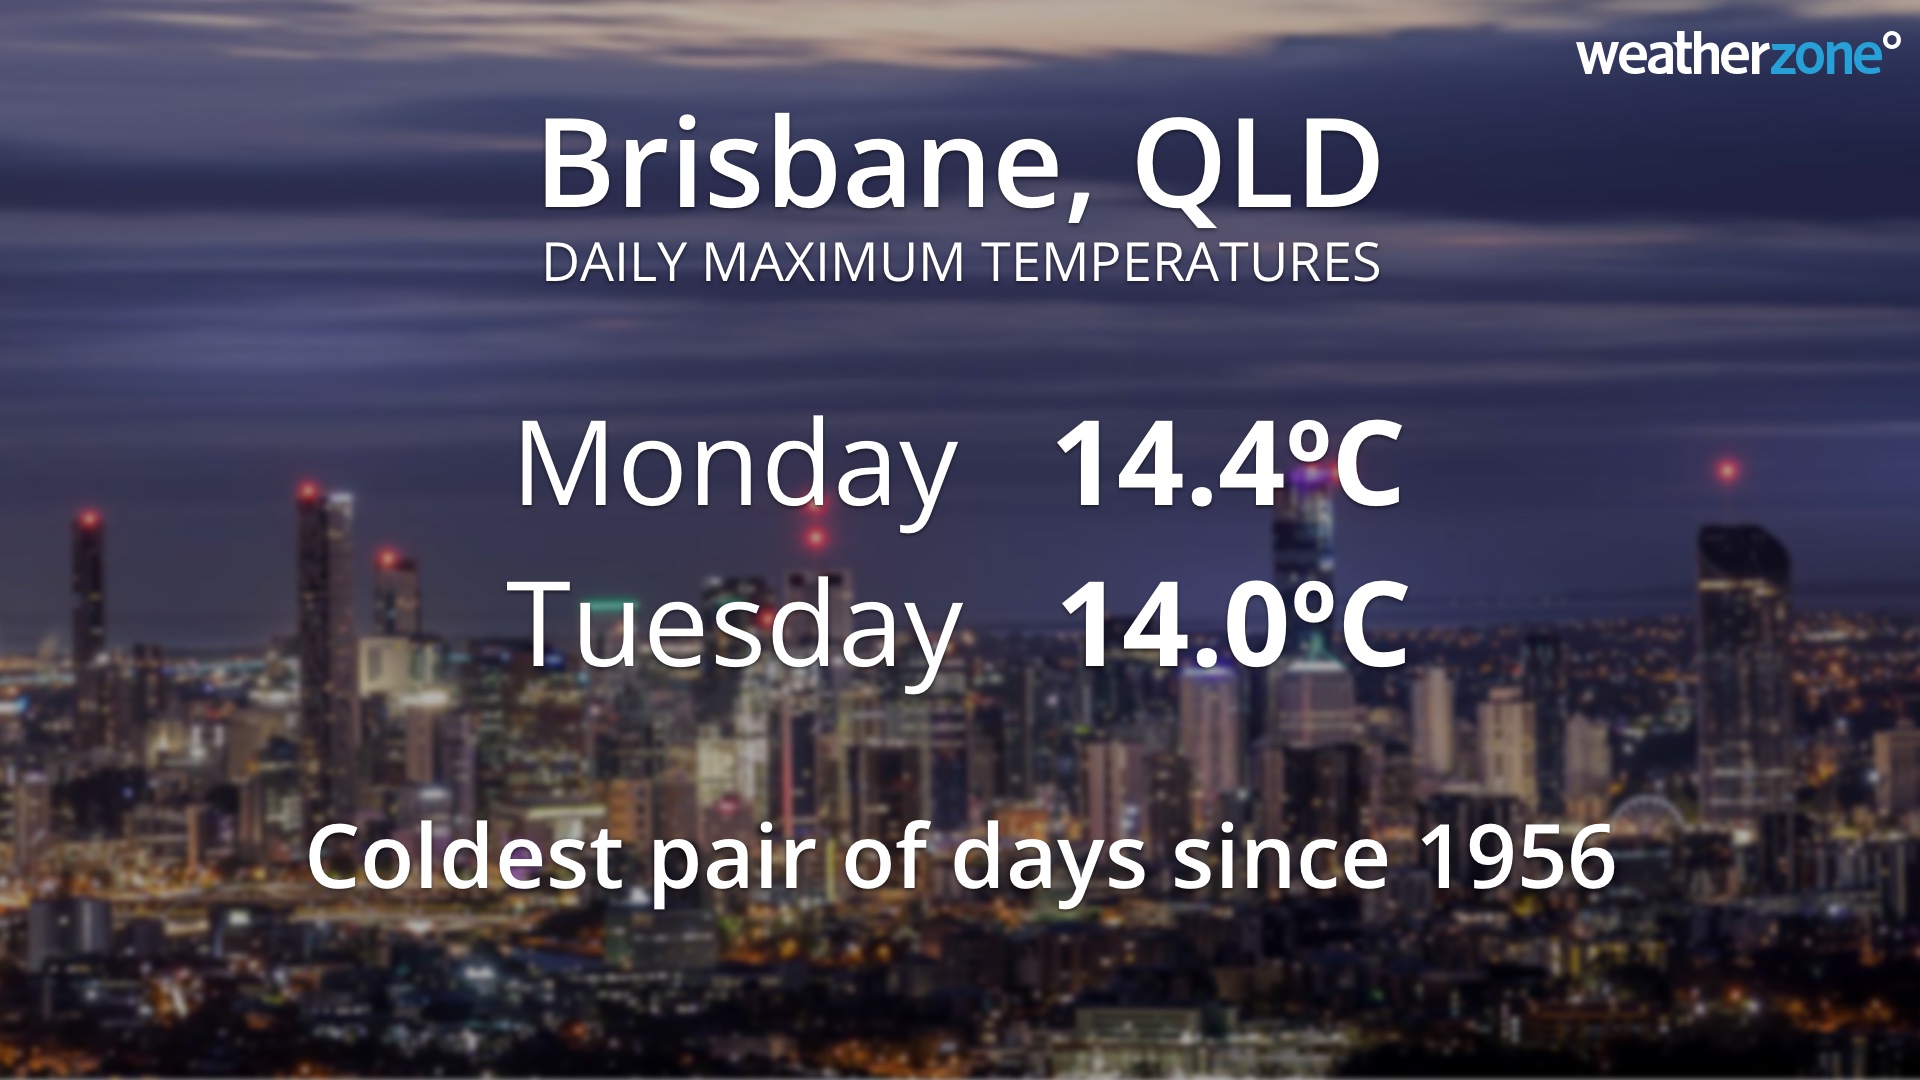
Blanketing cloud cover and persistent rain sent shivers across large areas of Queensland over the last 48 hours, with Brisbane enduring its coldest pair of days since 1956.

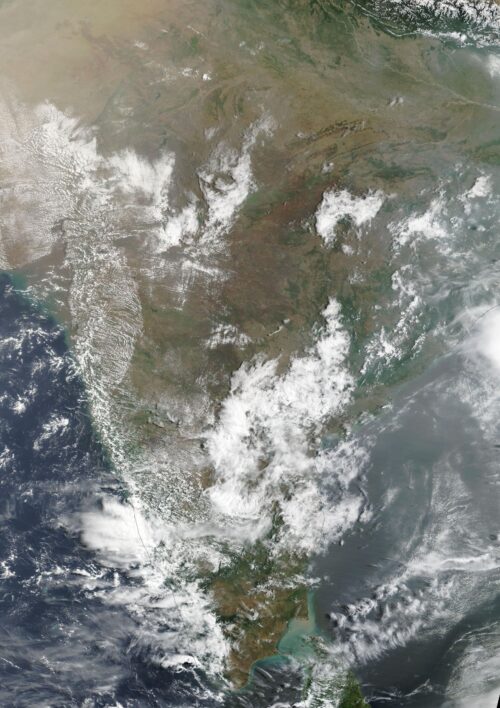
The sequence of satellite images below shows a large cloud band slowly passing over central and southeast QLD during the last two days.

Daytime temperatures on Monday and Tuesday were very cold by QLD standards beneath this deck of thick cloud. Maximums stayed about 8 to 12ºC below the July average in large areas of central and southeast QLD, with some places experiencing their coldest weather in more than half a century.

Brisbane’s official maximum temperatures on Monday and Tuesday were 14.4ºC and 14.0ºC respectively, making Tuesday the city’s coldest day in nine years. These maximums are both well below the city’s long-term July average of 22ºC. It was also Brisbane’s first pair of days below 15ºC since 1956.

The cold weather of the last two days was widespread across QLD, with Townsville (15.1ºC), Bundaberg (12ºC) and Gympie (13C) all registering their coldest day in 15 to 17 years this week.

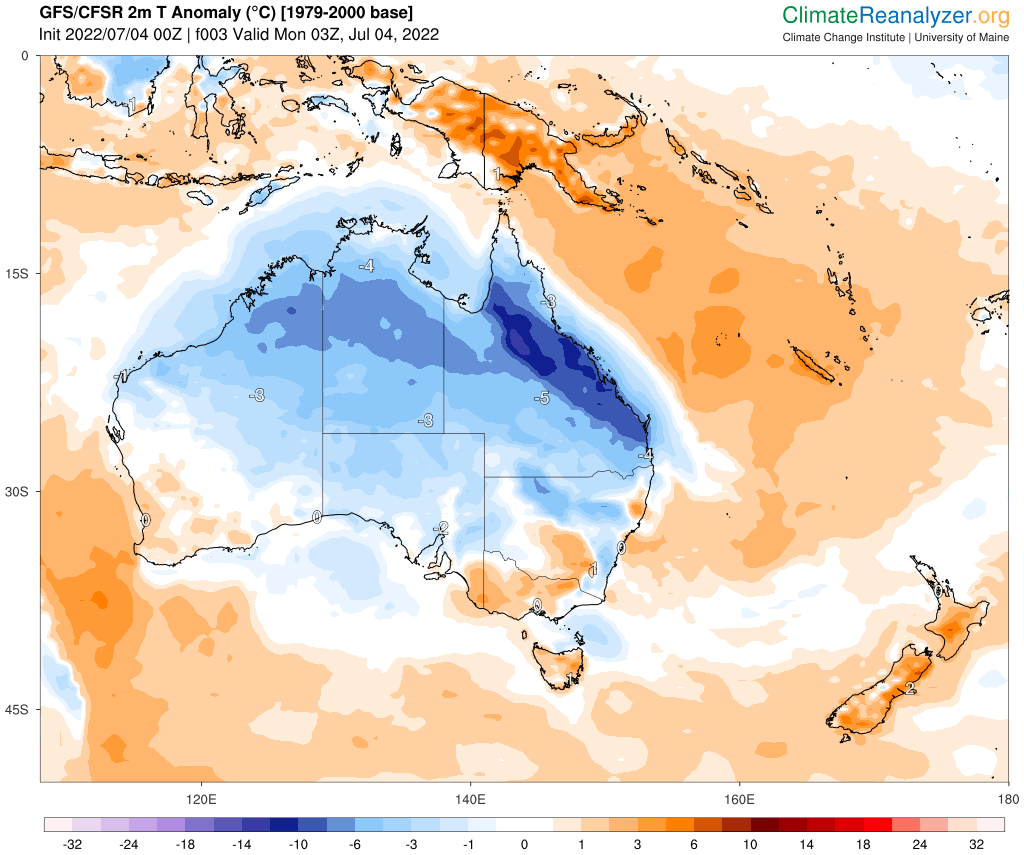
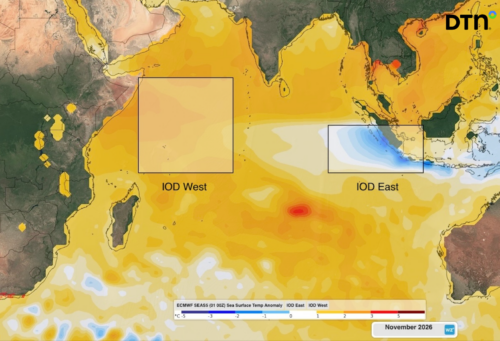
Image: Modelled air temperature anomalies over Australia on Monday afternoon, July 4, showing well below-average temperatures across much of Queensland. Source: ClimateReanalyzer.org

Fortunately for those Queenslanders that don’t like this week’s wintry chill, sunnier and warmer weather will return over the next few days as the cloud band moves out across the Coral Sea. For more information on our temperature and energy forecasts, please contact us at apac.sales@dtn.com.

Latest news

Satisfy your weather obsession with these news headlines from around the nation, and the world.

Rapid El Niño signal accelerating risk for Australian businesses

El Niño–favourable conditions are gathering pace across the tropical Pacific, with key ocean indicators approaching threshold levels and early atmospheric responses emerging.  While uncertainty remains around final El Niño strength, historical analogues show that even weak events can generate widespread impacts, including reduced rainfall, warmer daytime temperatures, increased frost risk, elevated fire danger, reduced tropical cyclone activity, and more. Industries including […]

Australia’s 2025–26 Cyclone Season: Slightly Above Average, Dominated by Severe Systems

Australia has just experienced a highly impactful tropical cyclone season, with more than 60% of systems reaching severe intensity, causing widespread disruption and damage to communities and multiple industries across northern Australia.  The 2025–26 Australian tropical cyclone season officially ran from 1 November 2025 to 30 April 2026. During this six-month period, Australia saw 11 tropical cyclones, with nine […]

What does a ‘super El Niño’ mean for Australia’s businesses?

There are signs that a very strong, or ‘super’ El Niño could develop in the tropical Pacific Ocean later this year. So, what does this mean for Australia’s weather during the second half of 2026? El Niño on the horizon The tropical Pacific Ocean is currently in a neutral state, meaning neither El Niño nor […]

How does DTN help businesses monitor bushfire induced pyrocumulonimbus thunderstorms that ignite more fires?

Intense heat from bushfires during elevated fire danger days can trigger fire-induced pyrocumulonimbus thunderstorms that ignite additional fires. In early January 2026, an extreme heatwave sweeping over southeastern Australia brought catastrophic fire danger to Victoria. Intensely hot bush and grass fires spread erratically and quickly in hot, dry and gusty winds, with pyrocumulonimbus generating lightning, […]