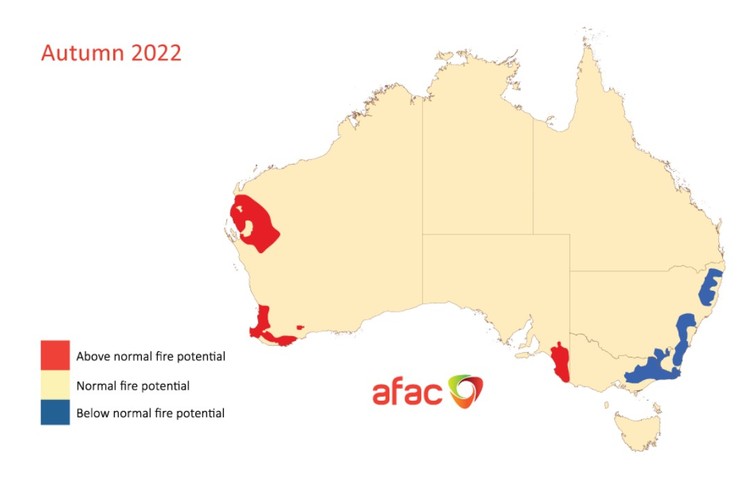
The autumn bushfire outlook has been released by the National Council for Fire and Emergency Services, and as you’d expect given the wet, La Niña-influenced summer in the east, and the scorching WA summer, the outlook is very different on opposite sides of the country.
Let’s run through some of the main points in relation to the image below.

Source: AFAC.
Western Australia has had numerous serious bushfires over summer, and the fire potential will continue to be above normal during autumn.
That’s because of the extremely hot and dry summer which we’ve written about here numerous times at Weatherzone, including the recent ongoing hot spell. For example, as of last Sunday:
- Perth recorded its 31st day at or above 35°C so far this summer. This is the equal highest number of 35°C days on record for a single summer, matching the same feat in 1977/78.
- There were also 13 days at or above 40°C this season as of Sunday, smashing the previous summer record of seven 40°C days in the summer of 2015/16.
As mentioned, much of the east coast is a totally different story, with below normal bushfire potential for autumn, and there are two reasons for that.
- The first is the still relatively low fuel loads in many areas that burned in the Black Summer of 2019/20.
- The second reason, obviously enough, is rain. And while fuel loads are high in some area because of all that rainfall, the vegetation is green and wet in many places, and soil is moist or saturated.
Meanwhile the southeast corner of South Australia can expect above normal bushfire potential as it has been a dry summer there.
While something like 90% of SA had well above average rainfall over most of summer, and especially the first two months, the southeast corner missed out, despite being the soggiest part of the state in terms of yearly averages.
The South Australian rainfall data and indeed all the national rainfall anomalies are well captured in this BoM graphic which shows the two-monthly rainfall deciles for Australia.

Source: BoM.
It’s interesting how red (less rain than usual) and blue (more rain than usual) overlaps quite closely the high fire danger (red) and comparatively low fire danger (blue) in the map at the top of this story.
As ever, this information is just a guide. Fires can break out in any part of the country in autumn, especially early in the season.
And while most of Australia shows normal bushfire potential during the autumn outlook period, anyone living and working in these areas needs to be vigilant. Destructive and deadly fires can still occur during normal bushfire seasons anywhere across Australia.
Weatherzone’s forecasts for the forestry industry
High fire danger ratings, wind and lightning are all a risk to the forestry industry and Weatherzone has several solutions. Weatherzone owns and operates the Weatherzone Total Lightning Detection Network, one of the most advanced networks of its kind in the world. Lightning detection is an imperative tool for outdoor operations and infrastructure and personnel safety.
Smart lightning alerts can also be set up based on where your assets and business are located. Whether you want alerts set up for lightning within 5km or 50km, we can tailor these alerts to your specific needs.
Weather forecasts can also be tuned to your exact location when an Automatic Weather Station (AWS) is installed on-site. Weatherzone’s model Opticast updates every 15 minutes based on your AWS observational data, which can be deployed onto your site. The system works by taking forecasts from a range of computer models and comparing them with observations to produce the most accurate forecast possible.
When AWS’s are deployed on your site, Opticast’s forecasts can be tailored to your specific location, rather than the nearest town or city’s weather station. This provides you with ultra-local forecasts, based on your site’s observations.
Weatherzone’s storm query can also help your business perform post-event analysis. Users can look at any point of interest and query when and where lightning happened and attribute whether the event was caused by a storm. Storm Query can also help businesses complete risk analysis using climatology of lightning in the area.
For more information on Weatherzone’s services and how we could help you, please contact us at apac.sales@dtn.com