

The tropical Pacific Ocean has rapidly warmed to a ‘very strong’ El Niño threshold for the first time in more than 10 years, a milestone that puts extreme heat, water stress and higher energy demand squarely on the radar for businesses across Australia and Southeast Asia in the upcoming seasons.
El Niño was declared by the Bureau of Meteorology in the middle of June this year following four months of persistent warming in the tropical Pacific Ocean, along with a response from the overlying atmosphere. Since then, El Niño has been rapidly gaining strength.
Ocean warming – Relative Niño 3.4 index rising rapidly
The main oceanic index used to monitor El Niño is the relative Niño 3.4 index, which is a measure of sea surface temperature anomalies in the central equatorial Pacific Ocean. This index factors in the background warming influence of climate change to make sure the current water temperature anomalies can be accurately compared to those from past years.
According to the Bureau of Meteorology, El Niño occurs when sustained monthly values of the relative Niño 3.4 index are above 0.8°C. The U.S. Climate Prediction Center (CPC) also uses the following thresholds to identify the strength of El Niño based on the relative Niño 3.4 index:
- Moderate El Niño: +1.0°C to +1.49°C
- Strong El Niño: +1.5°C to +1.99°C
- Very Strong El Niño: +2.0°C and above
According to data from the Bureau, the relative Niño 3.4 index reached +2.02°C during the week ending on August 2, 2026. This is the first time the Bureau’s weekly index has exceeded +2.0°C since February 2016.
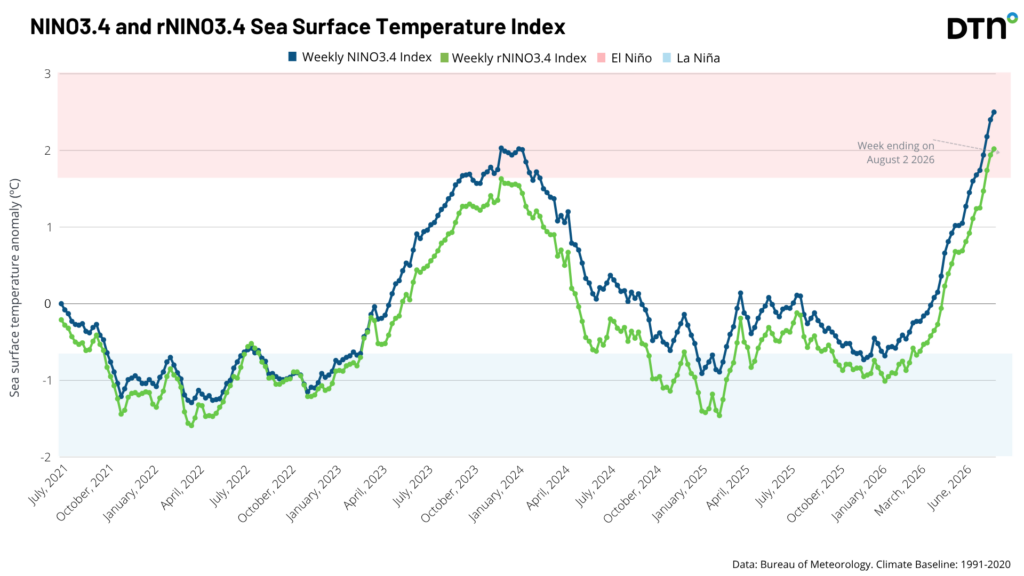
Image: Weekly relative Niño 3.4 index. Source: DTN
While the weekly Niño 3.4 index exceeding +2.0°C is a milestone, it will need to remain above this threshold for several months to be recognised as a very strong El Niño event.
Atmosphere responding
El Niño is a coupled ocean-atmosphere phenomenon, meaning it occurs when there are changes in both the ocean and atmosphere that interact and reinforce each other. This feedback loop between the ocean and atmosphere helps sustain and amplify El Niño events.
One of the main atmospheric indices used to monitor El Niño is the Southern Oscillation Index (SOI), which measures the mean sea level pressure difference between Darwin, in northern Australia, and Tahiti, in the central Pacific Ocean.
When El Niño is underway, air pressure over Darwin becomes higher than the pressure over Tahiti, which causes the SOI to become negative. Sustained negative values below -7.0 indicate the presence of El Niño. Over the past 90 days, the average SOI has been around -21.4.
Other atmospheric indicators are also showing signs of a well-established and strengthening El Niño, including weakened or reversed trade winds over parts of the tropical Pacific Ocean and reduced cloudiness near the international date line.
How strong will this El Niño get?
Global forecast models predict that El Niño will continue to gain strength in the coming months, likely reaching its peak towards the end of the year. Given its current and projected strength, it will likely persist into early 2027.
The Bureau of Meteorology’s ACCESS-S model predicts the monthly relative Niño 3.4 index will peak at around +3.5°C in November 2026. According to Bureau data, this would easily beat the previous monthly relative Niño 3.4 record of +2.65°C from November 1902.
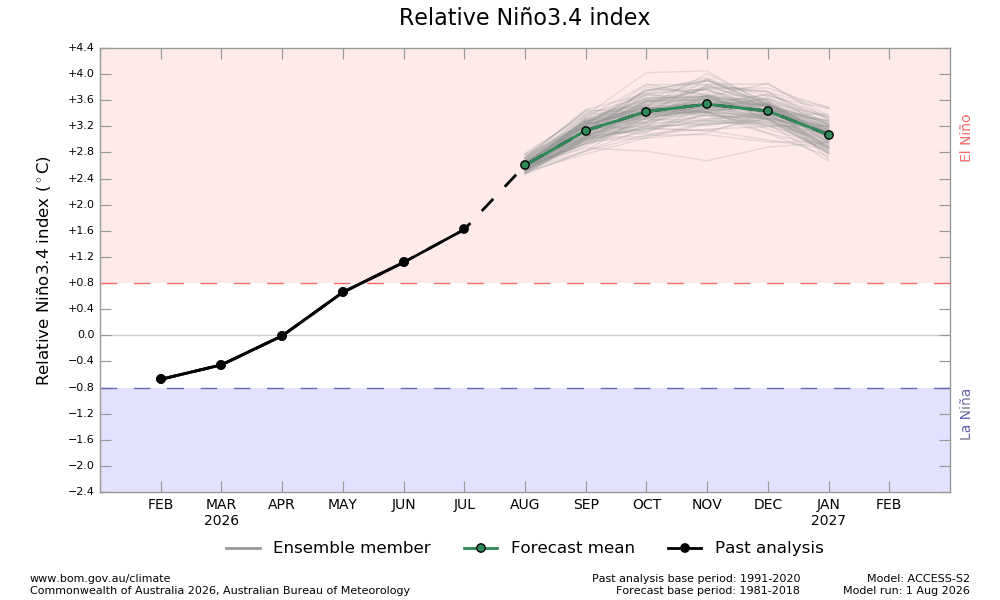
Image: Monthly Niño 3.4 index outlook, according to the ACCESS-S model. Source: Bureau of Meteorology.
What will this record-challenging El Niño mean for our weather?
The World Meteorological Organization‘s (WMO) modelling points to an increased chance of above-average temperatures across most land areas globally, with wetter-than-normal conditions likely across the Greater Horn of Africa, parts of Central Asia, Southern Europe, western North America and southeastern South America and drier-than-normal conditions more likely over the Indian subcontinent, southern and eastern Australia, southern Central America, the Caribbean, northwestern South America and northern Europe.
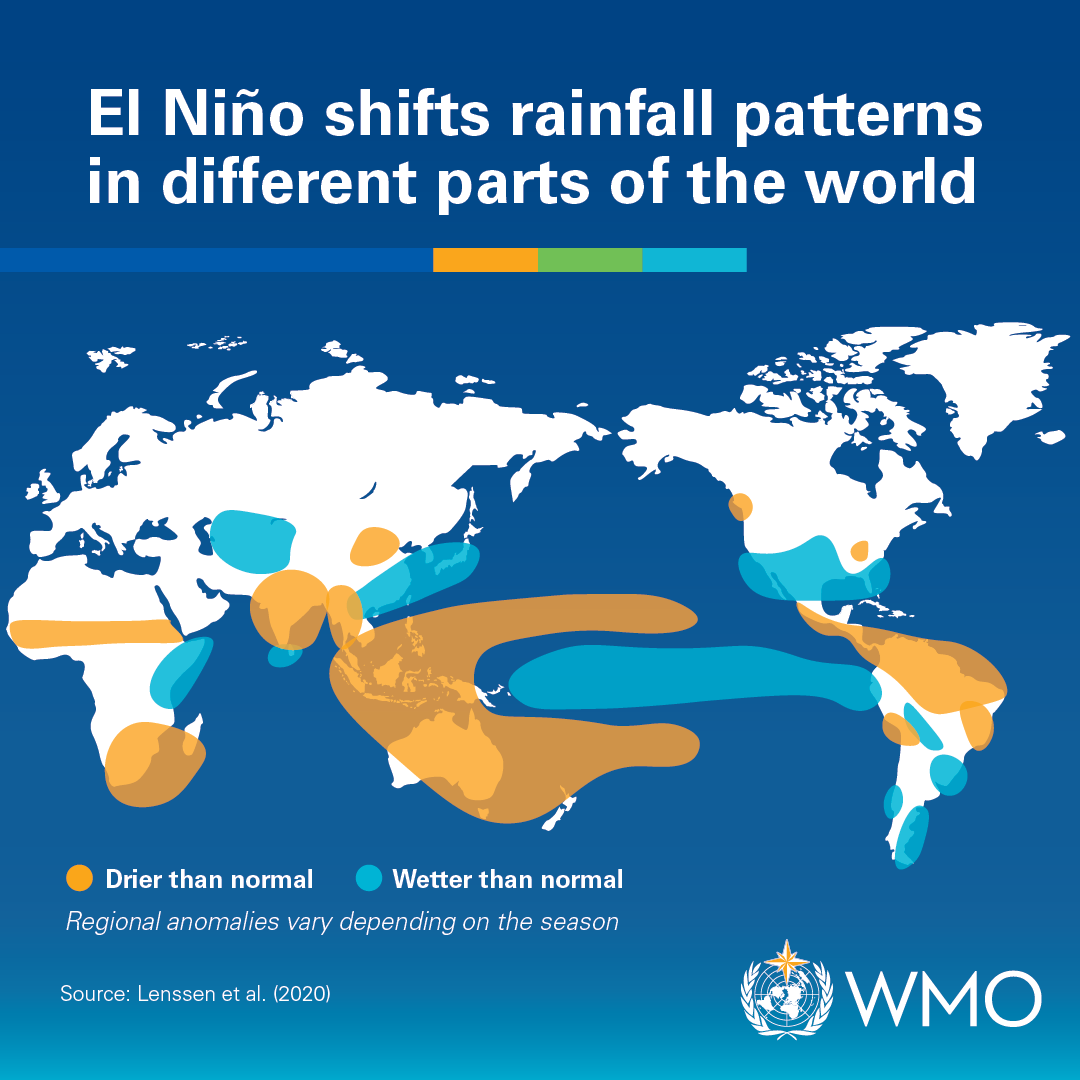
Image: Typical global rainfall impacts from El Niño. Source: WMO.
In Australia, El Niño typically lifts the odds of below-average rainfall and above-average daytime temperatures, raises drought and bushfire risk, and increases the chance of a below-average alpine snow season. The Bureau’s latest outlooks point to below-average rain across most of eastern Australia and higher-than-normal temperatures nationally for August–October.
How could El Niño impact businesses across the APAC region?
A very strong El Niño doesn’t automatically mean more severe impacts than a moderate one, past events show impact strength doesn’t scale neatly with index strength. But an event of this magnitude has no historical precedent to draw on, so businesses are being asked to plan for genuinely uncharted territory this year.
Sector by sector, the exposure across the region looks like this:
- Mining (Australia and Southeast Asia): Drier ground can help productivity, and reduced cyclone numbers may mean fewer weather-related shutdowns for northern and offshore operations, but heat stress on workers and equipment, dust events and fire risk near operations and infrastructure all need closer monitoring through spring.
- Energy: Above-average temperatures are likely to drive summer demand peaks, while spring wind generation could get a boost. Dry conditions raise fire risk near transmission infrastructure.
- Agriculture: Reduced winter and spring rainfall is likely to compress the cropping window in Australia’s winter-cropping regions, while India, Pakistan and the Philippines/Thailand face a materially elevated risk of monsoon disruption and water stress.
- Marine and ports: Increased wind and swell along the Australian coastline is more likely through spring, with knock-on effects for shipping schedules and coastal operations.
- Hong Kong and southern China: Wetter-than-normal conditions in July–August raise flood and landslide risk, with flow-on effects for logistics, construction and marine activity.
- Malaysia and Singapore: Typically drier than normal from July to September, with the signal flipping to wetter later in the year.
A positive Indian Ocean Dipole could also develop later this season, with the IOD index now over the positive threshold (+0.4°C) for the second consecutive week. However, this threshold will need to be maintained for several more weeks for it to be declared an official event. Combined with El Niño, that pairing tends to compound drying across Southeast Asia and Australia, even as it drives wetter conditions over India and southern China, an interaction DTN APAC will continue tracking closely.
For businesses managing operations across the region, the scale of this event means passive monitoring isn’t enough -seasonal outlooks, sub-seasonal forecasting and site-level risk assessment are the tools that turn a broad climate signal into an operational plan.
DTN APAC supports major industries to stay climate resilient
Learn more about our industry-leading weather intelligence, expert Risk Communicators, and more for major industries below:




