

One of Australia’s main climate drivers, the Indian Ocean Dipole (IOD), may be shifting into a phase that could impact the energy market, fire and emergency services, and mining operators in the late winter and spring.
What is the Indian Ocean Dipole?
Australia’s weather is shaped by the seasons – cooler winters, warmer summers, and rainfall patterns that vary significantly depending on the time of year and location. But layered on top of this natural seasonality are larger, slower-moving climate drivers that can push conditions above or below average for that time of year.
The most well-known climate driver that influences Australia’s weather is the El Niño-Southern Oscillation (ENSO), which alternates between El Niño, neutral and La Niña phases.
On the other side of Australia is a similar climate driver called the Indian Ocean Dipole (IOD).
The IOD is an index that measures the difference in sea surface temperature anomalies across the tropical Indian Ocean. It is calculated by comparing the anomalies in two defined regions:
- The IOD East region, which sits to the southwest of Indonesia
- The IOD West region, which lies off the east coast of Africa, near the Horn of Africa
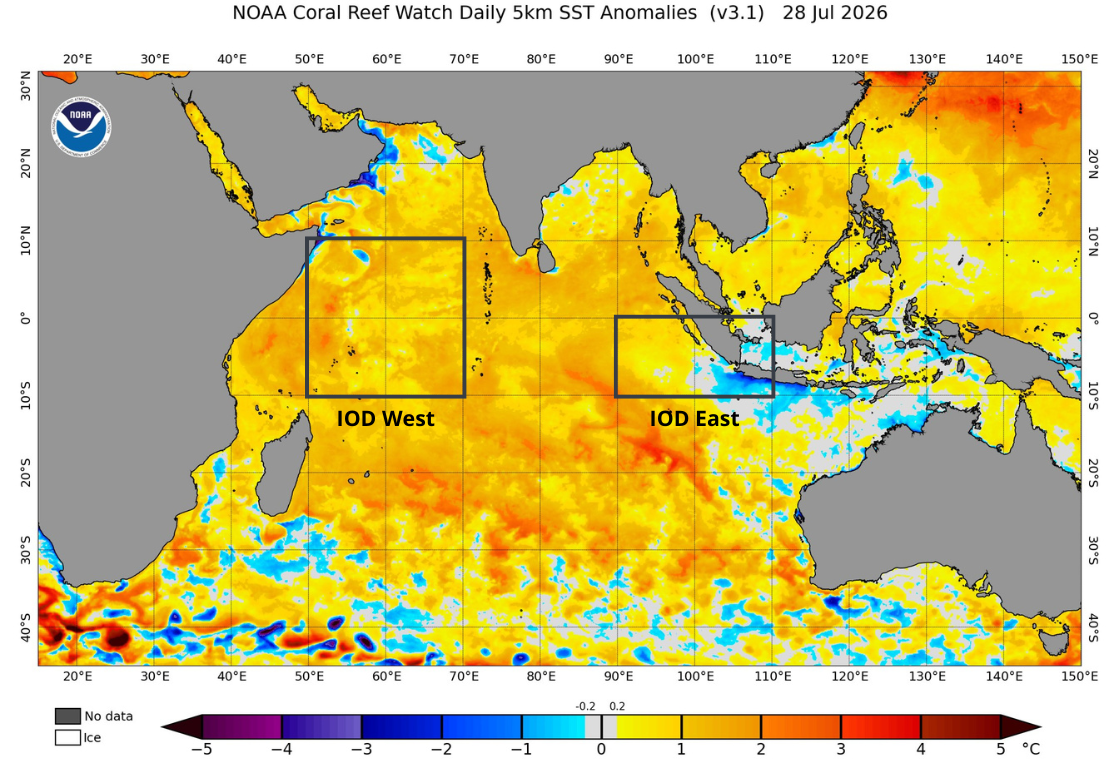
Image: Sea surface temperature anomalies in the Indian Ocean on July 28, 2026. The IOD West and IOD East regions are highlighted. Source: NOAA.
The IOD fluctuates between positive, neutral and negative phases.
A positive IOD occurs when sea surface temperatures are cooler than average in the IOD East region and warmer than average in the IOD West region. This phase is typically associated with abnormally warm and dry weather in Australia, particularly in winter and early summer.
A negative IOD occurs when cooler-than-average water sits in the IOD West region and abnormally warm water lies in the IOD East region. This phase often causes above average rain and below average maximum temperatures in Australia.
A developing positive IOD is exactly the kind of signal that shows up across multiple industries at once:
- Energy: Warmer, drier conditions lift cooling demand into spring and summer, while reduced inflows can pressure hydro generation and dampen catchment-driven power pricing assumptions.
- Forestry/Fire and Emergency Services: A positive IOD is a known preconditioning driver for elevated bushfire risk into the following fire season, relevant to resourcing, aerial firefighting contracts and community warning planning.
- Insurance: Dry, hot outlooks feed directly into bushfire and property risk pricing, reinsurance treaty renewals, and catastrophe modelling assumptions for the coming season.
- Mining: Drier conditions can ease some surface water and haul road disruption risk in wet-prone regions, but heightened fire and heat-stress risk affects site safety planning, tailings dam water balances, and dust/air quality management.
What is the IOD doing now?
The weekly IOD index rose to +0.44°C during the seven days ending on July 26, which is the first time it has exceeded the positive IOD threshold of +0.4°C since March this year.
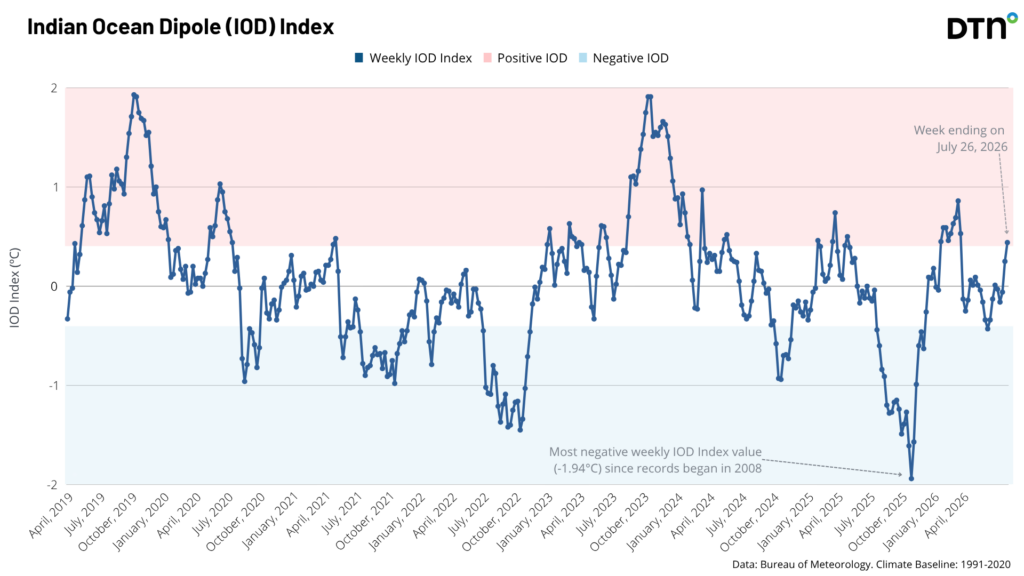
Image: Weekly IOD index values. Source: DTN
This is a sign that a positive IOD may be developing, however, the index will need to remain above +0.4°C for several consecutive weeks for this to be declared as a positive IOD event.
Forecast models suggest that this could be the start of a positive IOD event. According to the Bureau of Meteorology, “models suggest a positive IOD may develop during the southern hemisphere winter and persist into spring, although there remains some variation in the timing and strength of this potential event.”
In addition to the potential positive IOD, the coming months will also be influenced by an established and strengthening El Niño in the Pacific Ocean. This climate driver will also promote abnormally dry and warm weather in Australia through late winter and spring.
Seasonal forecast models are responding to the influence of these two climate drivers, hinting at drier-than-average weather over large parts of Australia in the coming months.
The complication: tropical waves moving into the IOD East region
Despite the index reaching the positive IOD threshold this week, atmospheric outlook charts for early August 2026 show active Madden-Julian Oscillation (MJO) and Kelvin wave signals tracking directly into the IOD East region, near Indonesia. This is the same patch of ocean that needs to stay cool for a positive IOD to consolidate. The teal shading in the map below shows areas of enhanced cloud and rainfall; brown/tan marks areas of suppressed, drier conditions. The teal patches forecast over the IOD East region in August in the top two panels are the visual signature of the wet, convective pulse working against the cooling that region needs.
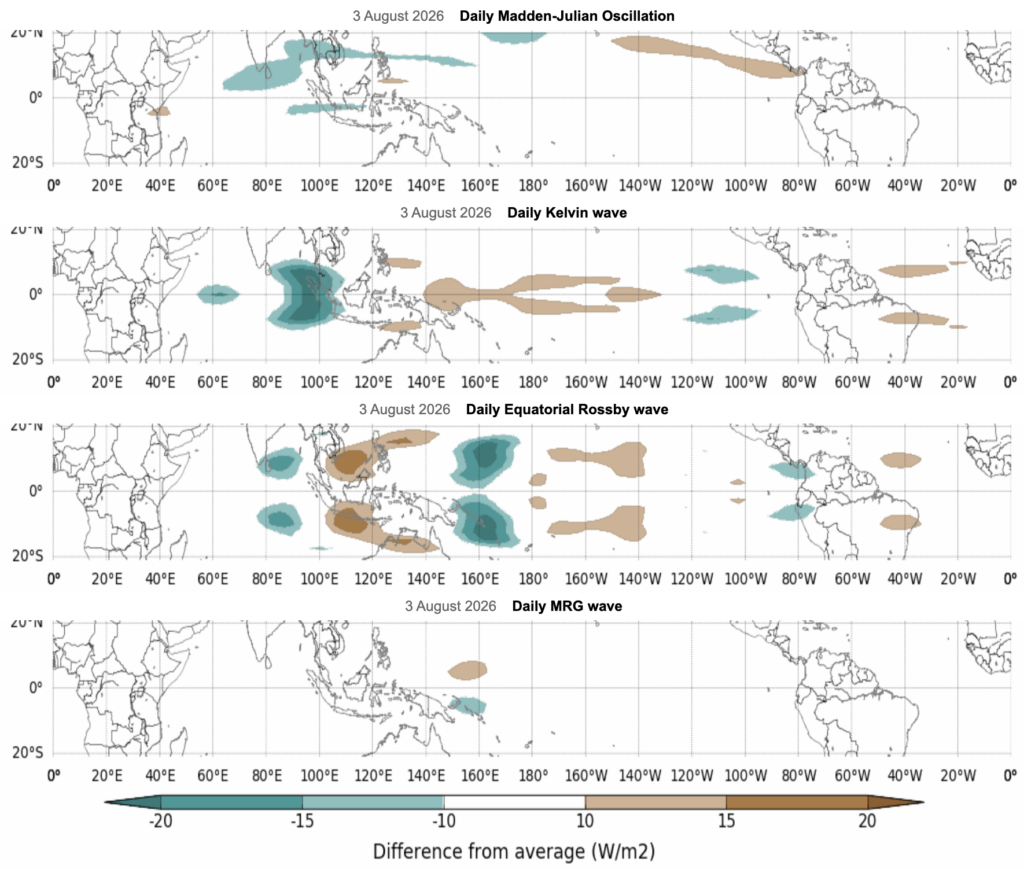
Image: MJO, Kelvin Wave, Daily MRG, Daily Equatorial Rossby wave forecast for August, 3, 2026. Source: Bureau of Meteorology.
Briefly, what these are:
- MJO: A large-scale pulse of enhanced or suppressed tropical rainfall and convection that circles the globe eastward over roughly 30–60 days.
- Kelvin wave: A faster-moving, eastward-propagating burst of convection that often travels ahead of or alongside the MJO.
- Equatorial Rossby wave: A slower, westward-propagating convective pattern, often paired with Kelvin wave activity.
- MRG (mixed Rossby-gravity) wave: A smaller-scale, faster westward-propagating disturbance, often linked to tropical cyclone formation.
This matters because a positive IOD depends on the East region staying cool and relatively dry. A pulse of enhanced convection moving through, as the MJO and Kelvin wave signals are forecast to, can locally warm the sea surface and increase cloudiness and rainfall, working directly against the cooling the East region needs to sustain a positive reading. These atmospheric pulses could interrupt the cooling trend and delay, or derail, the qualifying run needed to clear the Bureau’s eight-week threshold above +0.4°C.
DTN APAC Meteorologists will be watching the IOD and the tropical waves closely in the coming weeks to see if these early signs of a positive IOD mature into a fully fledged event. Learn more about how we support major industries across Australia and Asia Pacific below:
Featured image: Sea surface temperature anomalies on July 28, 2026. Source: ECMWF / Copernicus.




