Australia is battling through an exceptionally humid end to the year skyrocketing energy demand, so what’s behind it? What are ‘feels–like’ temperature and dewpoint?
During November, large areas of Australia experienced uncomfortably humid conditions, with the sticky conditions seeping down into southern Australia, which usually has a drier climate. Large parts of the NT, northern WA, southern Qld and eastern NSW have seen dewpoints peak at 4 to 6°C above the average.
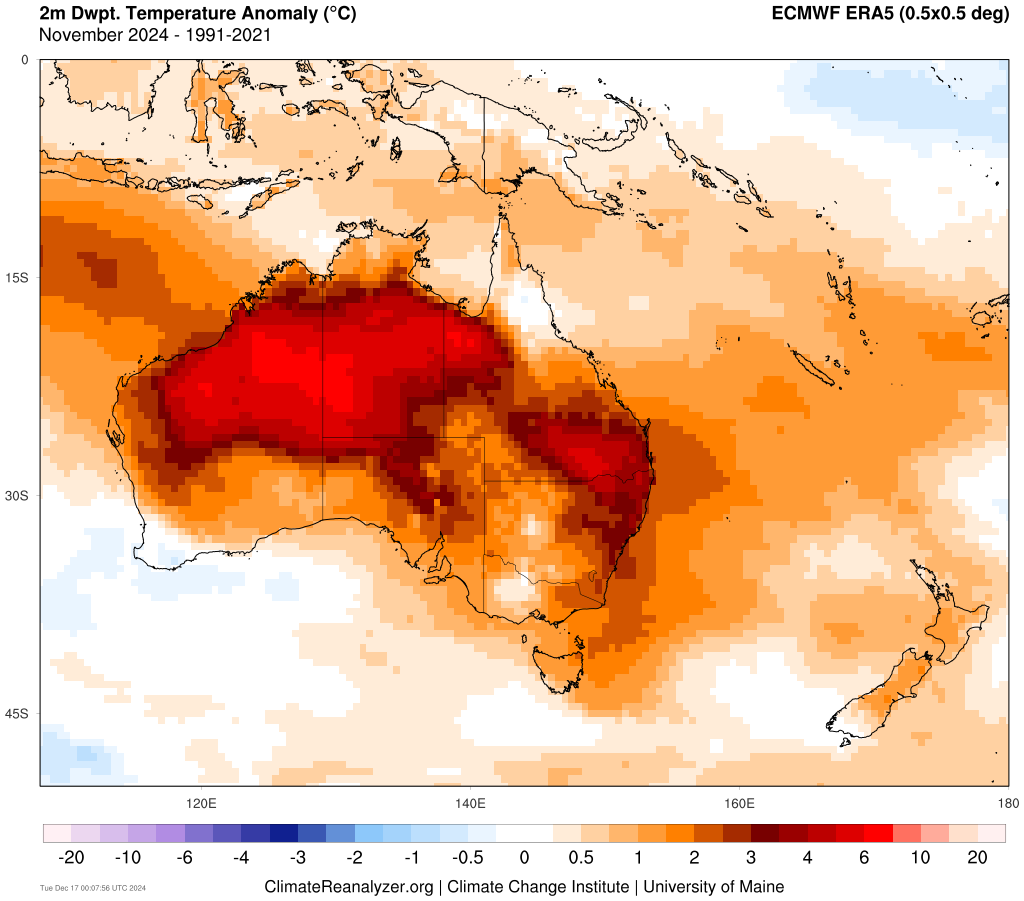
Image: Dewpoint temperature anomaly (°C) for November 2024 compared to the 1991-2021 average. Source: ClimateReanalyzer
The higher the dewpoint anomalies in the graph above, the greater the amount of moisture in the atmosphere, making it difficult for Australians to cool down through the evaporation of sweat.
The high levels of humidity increased energy demand across much of Australia during the past few months, with air conditioner use spiking as Australians sought comfort. Australia’s National Electricity Market recorded its highest energy demand in 4 years on Monday, December 16, 2024. The ‘Market Demand’ peaked at 33,674MW in the 5:30pm dispatch interval (NEM time), according to WattClarity.
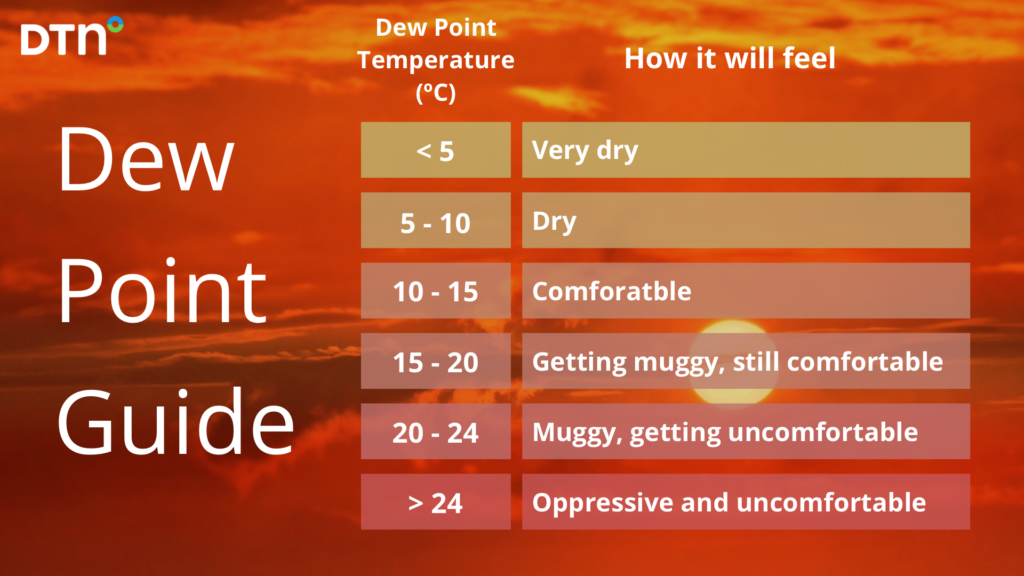
The dewpoint is the temperature at which air must be cooled to achieve a relative humidity of 100% or saturation of moisture in the atmosphere.
For example, this is how different dew point temperatures would make you feel if you were accustomed to Australia’s sub-tropical climate.
The high dewpoints across Australia in the past couple of months have been caused by abnormally warm Sea Surface Temperatures (SSTs) surrounding Australia.
The waters to the northwest of WA are currently as hot as 32°C, more than 2°C above average for this time of year.
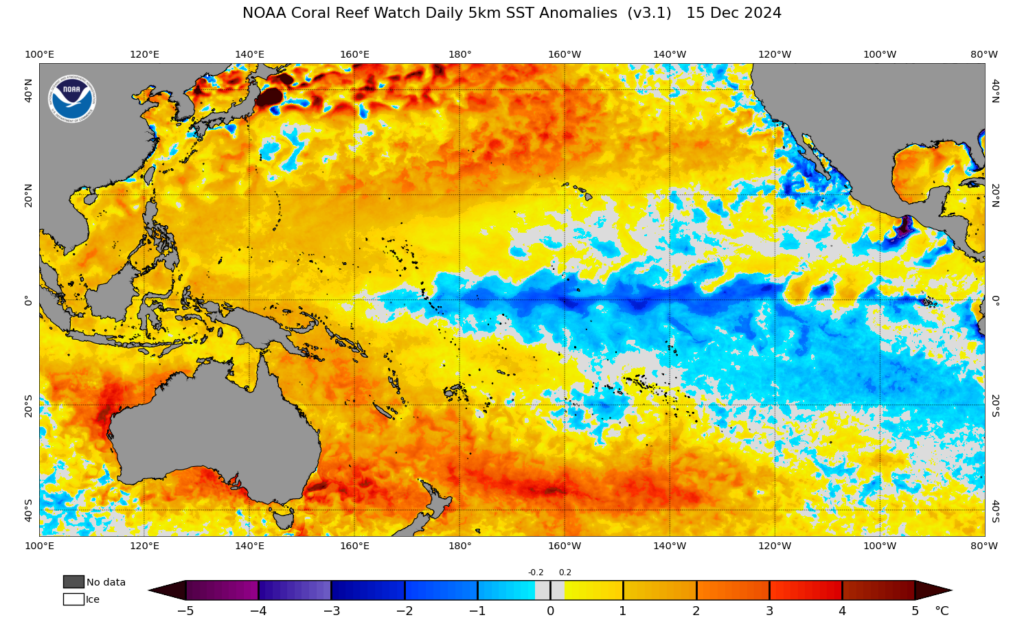
Image: Sea Surface Temperatures (SSTs) on Sunday, December 15 2024. Source: NOAA
These warm waters are adding additional moisture into the atmosphere when evaporated, which is fueling rain and thunderstorms across large parts of the country as well as making it feel uncomfortably sticky for many Australians.
This humidity is making the ‘feels-like’ temperature up to 2 to 5°C hotter than the actual temperature at times in some areas of Australia.
What is ‘feels-like’ temperature?
‘Feels-like’ temperature factors in a range of weather elements, besides the air temperature, which collectively affect how you feel. This is because, unlike a thermometer, you aren’t made of glass and liquid mercury. Your body and skin are incredibly efficient at reacting to different types of weather to make sure your internal temperature stays as close to 37°C as possible.
The main contributors to the feels-like temperature are:
- The actual air temperature
- The Relative Humidity (RH), i.e. how much moisture is in the air
- Wind speed
- If you are in the sun or not
- If it’s raining or not
Humidity
When it is too warm, your body produces sweat. What your body is doing is supplying moisture into the air so it can evaporate. When it does, it takes some heat away from your skin, known as ‘evaporative cooling’, which cools you down.
When there is a lot of moisture (humidity) in the air already, this process becomes slower, as the air can’t hold much more water. That is why the higher the humidity, the hotter it feels. Hotter air can hold exponentially more water than colder air, so at cold temperatures, this effect is negligible, but when it’s hot, minor changes in humidity can make it feel several degrees hotter.
Wind
Wind has the opposite effect to humidity. When the wind is blowing, it ensures that any sweat evaporating from your skin is quickly blown away, allowing more sweat to form and evaporate just as easily. This is what is commonly referred to as ‘wind chill’.
Wind chill is much easier to work out because it is linear i.e. doesn’t matter what temperature you are at. The rule of thumb is: for every 5 km/h increase in wind speed, the wind chill makes you feel one degree colder.
Sunlight & Rain
The final part is whether you are in the sun, in the rain, or neither. These are not actually things that go into the ‘feels-like’ temperature equation because it varies quite a lot depending on your surrounds and you as an individual. However, if you are in full direct sunlight, you typically feel 5-8 degrees warmer than if you were in the shade.
Conversely, if it is raining, the water draws heat away from your skin rapidly, making you feel much colder. Just how cold depends on the temperature of the water droplets, but typically you feel about 7-12°C colder when wet.
How do they figure out what the temperature feels like?
The ‘feels-like’ temperature is based on empirical evidence, rather than pure physics. It represents how the average person would perceive the weather conditions. This makes it more of a guide than a set rule, as different people will be more resilient or vulnerable to different weather conditions.
DTN regularly talks to its client not only about the temperature but the feels-ike temperature as it has a huge impact on energy usage in Australia.
DTN APAC supplies precise weather intelligence to over 75% of the National Energy Market (NEM); and is the trusted provider for the Australian Energy Market Operator (AEMO).
Weatherzone’s next-generation nowcasting and forecasting system, OpticastTM, is independently proven to outperform other industry models, allowing energy traders to respond rapidly to changing conditions. From 14 day forecasting to seasonal outlooks, you have access to complete and powerful weather intelligence giving you the confidence to make the best call.
Meeting the needs of the changing market, Weatherzone utilises high-resolution modelling and local knowledge to provide 5-min granularity observations and forecasts, optimising your market bidding and maximising your profits. These, coupled with briefings from our energy meteorologists, give you full awareness of the associated risk.
Benefit from specialised indices such as apparent temperature, Cooling/Heating Degree Days (CDD/HDD) and Effective Degree Days (EDD) to help accurately predict demand. You can get a clear picture of forecast conditions across the market and quickly assess heat/heatwave potential from 14 days out to 12 months
No matter where your energy trading focus lies, we have the power generation and weather insights to inform your critical decisions, keeping you ahead of the curve.
For more information please visit our website or email us at sales.apac@dtn.com.


