
Australia is a stormy country, with lightning striking part of every state and territory each year. But some parts of the country are far stormier than others. So, where is the most lightning-prone part of Australia?
Before looking at WHERE lightning occurs in Australia, it’s important to know HOW lightning occurs.
Thunderstorms require three key ingredients to form:
- Moisture-laden air in the lower levels of the atmosphere
- Instability in the atmosphere, which means temperature cools sufficiently with height
- A trigger mechanism, which is something that causes air to start rising or lifting
The stormiest places in Australia, and the world, are simply areas that have these three ingredients available in abundance.
The map below shows the annual average lightning density across Australia. Lightning density here represents the average annual number of lightning pulses per square kilometre that were detected by Total Lightning Network between 2015 and 2021.
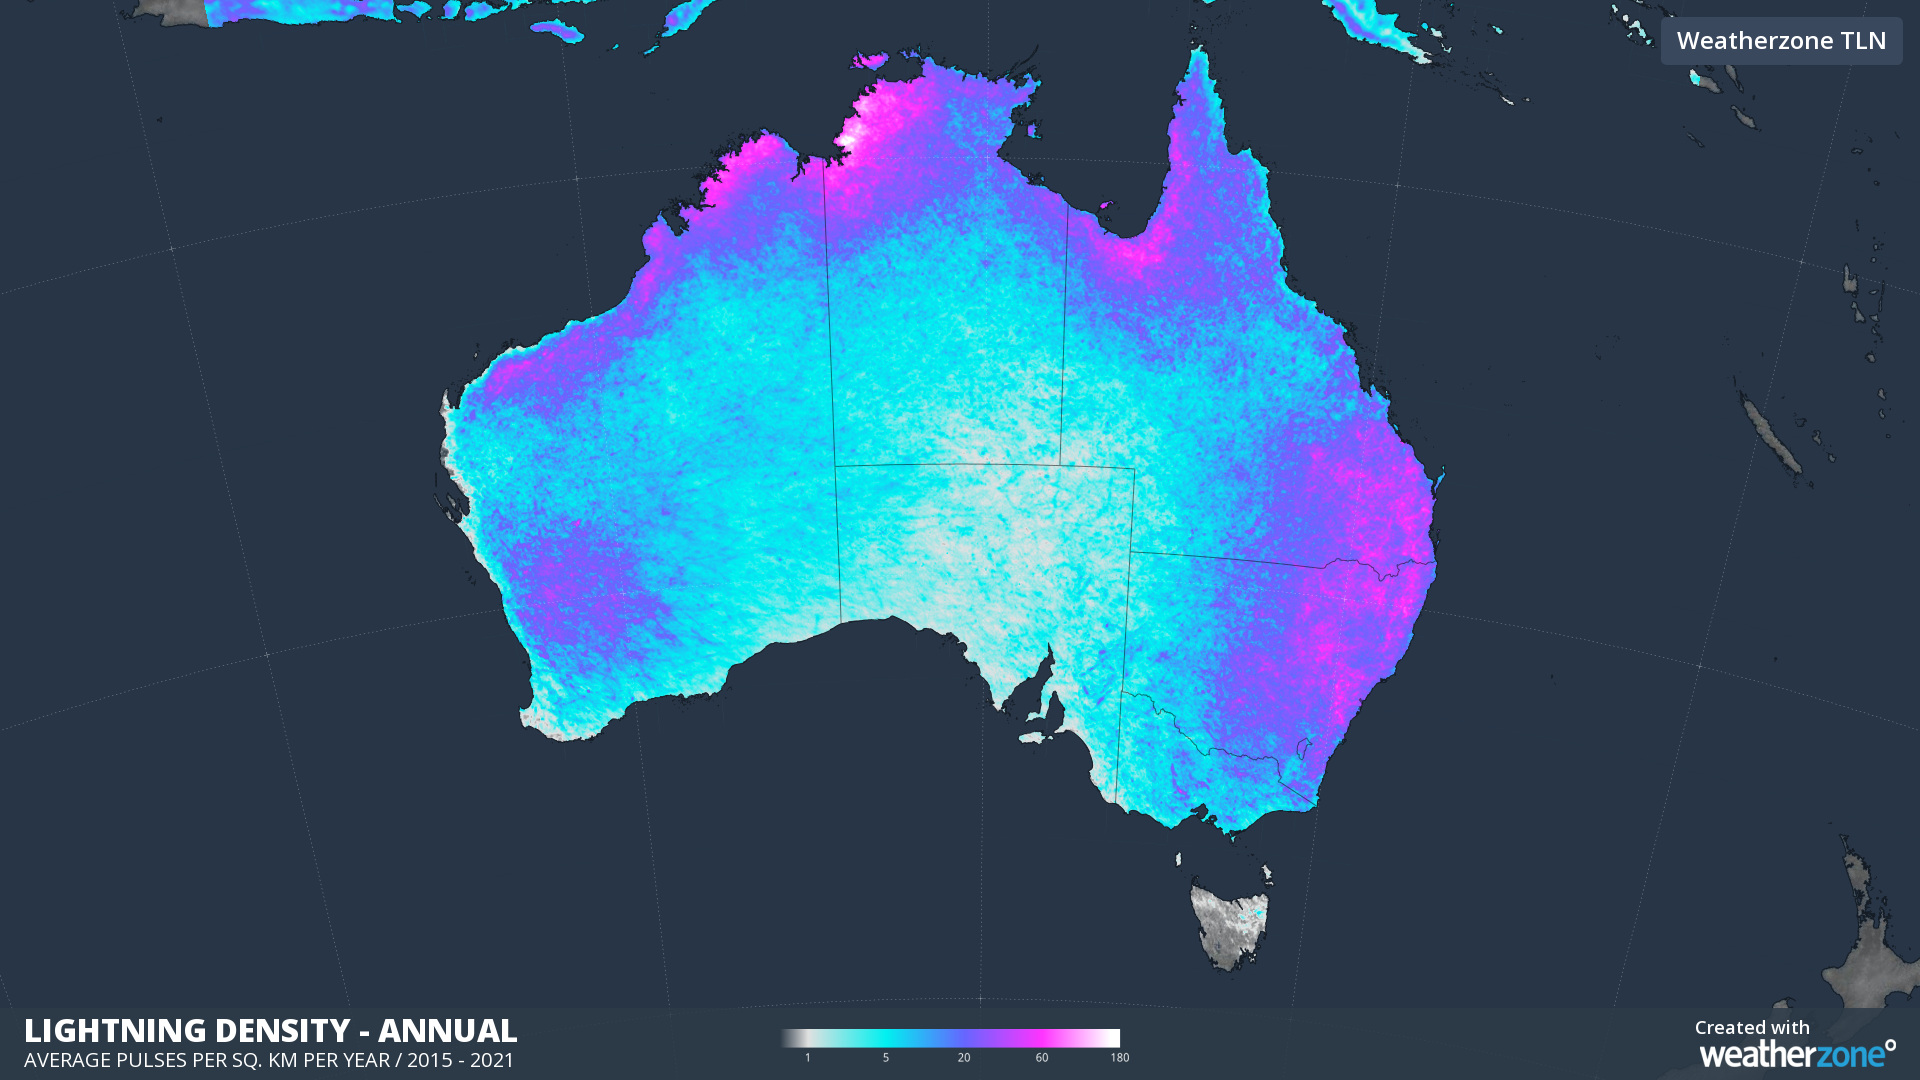
Before we dig into the numbers to find out where Australia’s stormiest place is located, there are a few interesting things that stand out on the map above at first glance.
Lightning occurs more frequently near the coasts and ranges in an upside-down horseshoe shape. This is because these areas have abundant moisture and the mountainous terrain helps initiate thunderstorms. Sea breezes also act as a frequent thunderstorm trigger in near-coastal zones, especially in northern and eastern Australia.
Central and far southern Australia are lightning-sparse, largely because these areas lack the moisture and/or instability needed for frequent thunderstorms.
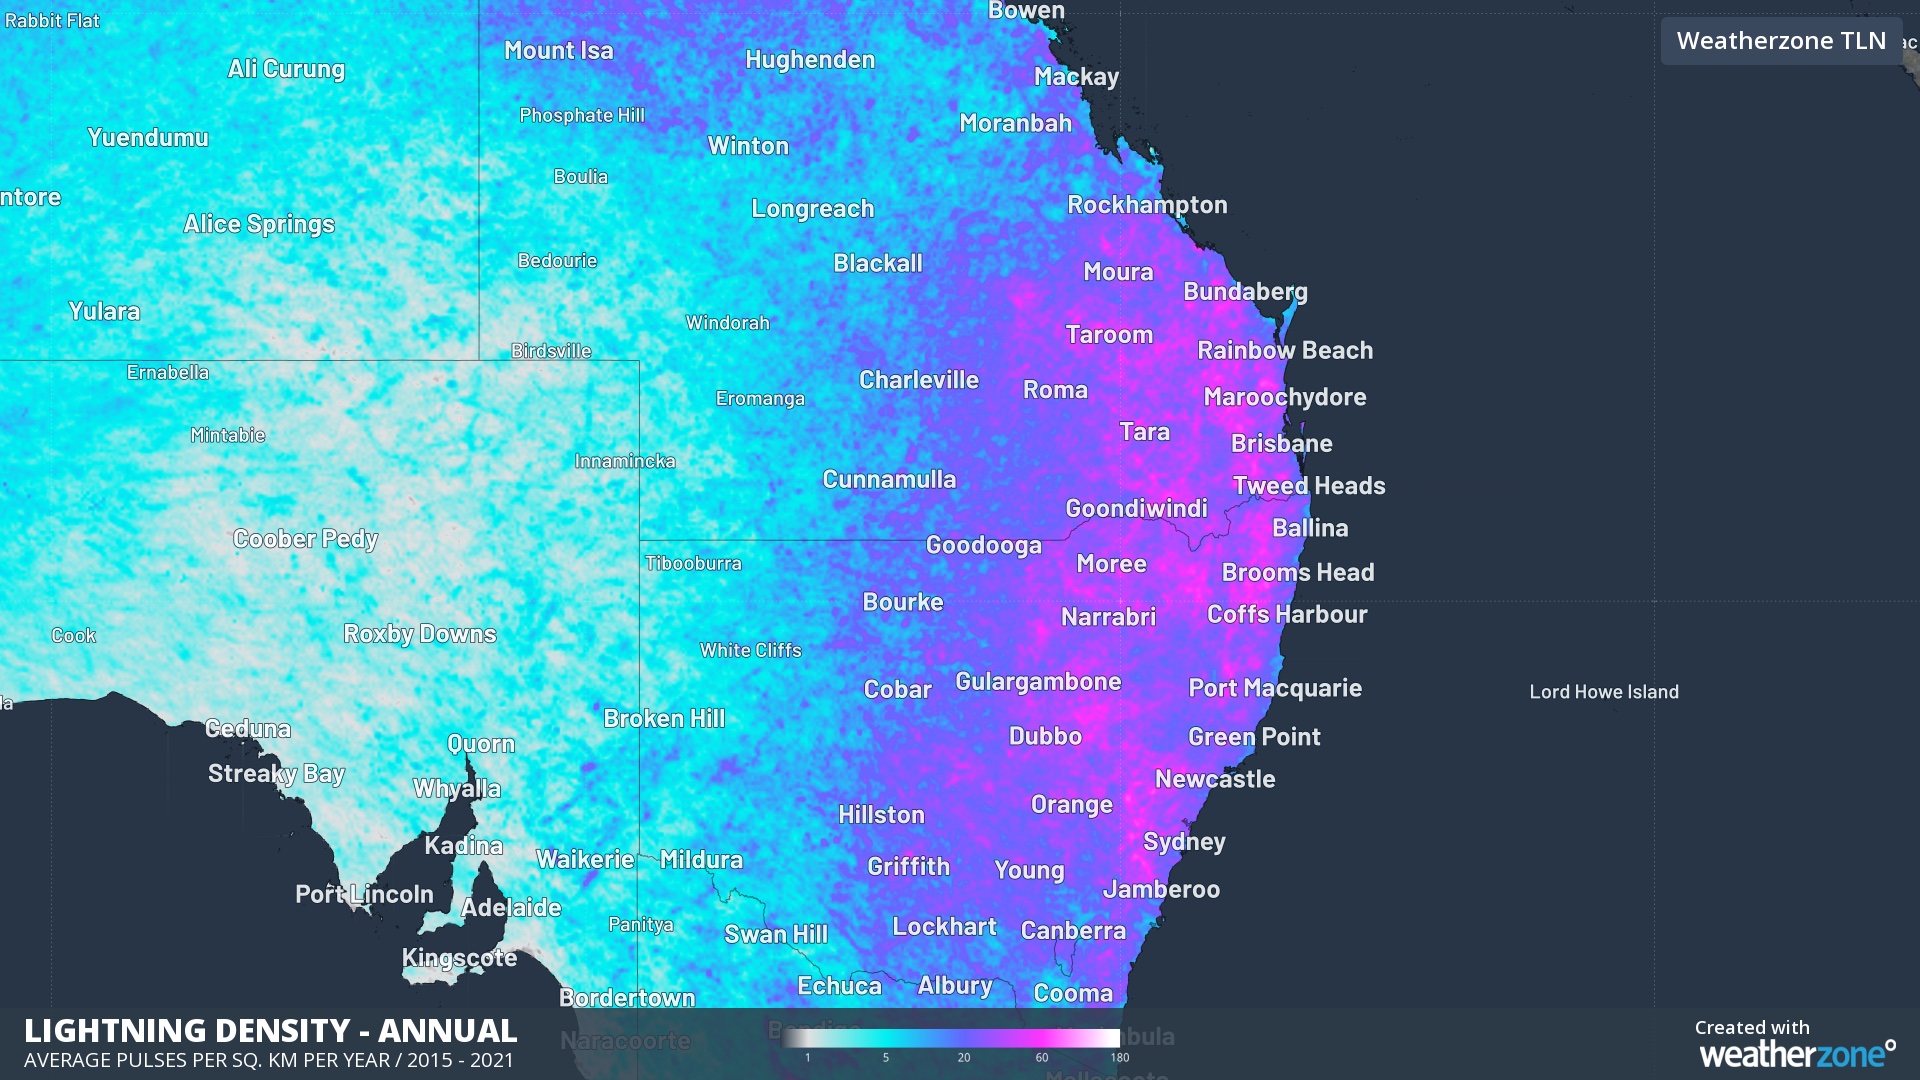
Eastern Australia has a broad area of dense lightning activity that stretches from southeast QLD down to central NSW. This region is often at the confluence of warm and moisture-laden air coming from the north or east, and colder air moving in from the south or west. These contrasting air masses can give rise to violent thunderstorm activity, especially during spring and summer.
Another lightning hotspot is over far northern Australia, including portions of northwest QLD, the western Top End and the northern Kimberley. While these areas are predominantly dry and storm free for around half of the year, they become hotbeds for thunderstorms in the wet season.
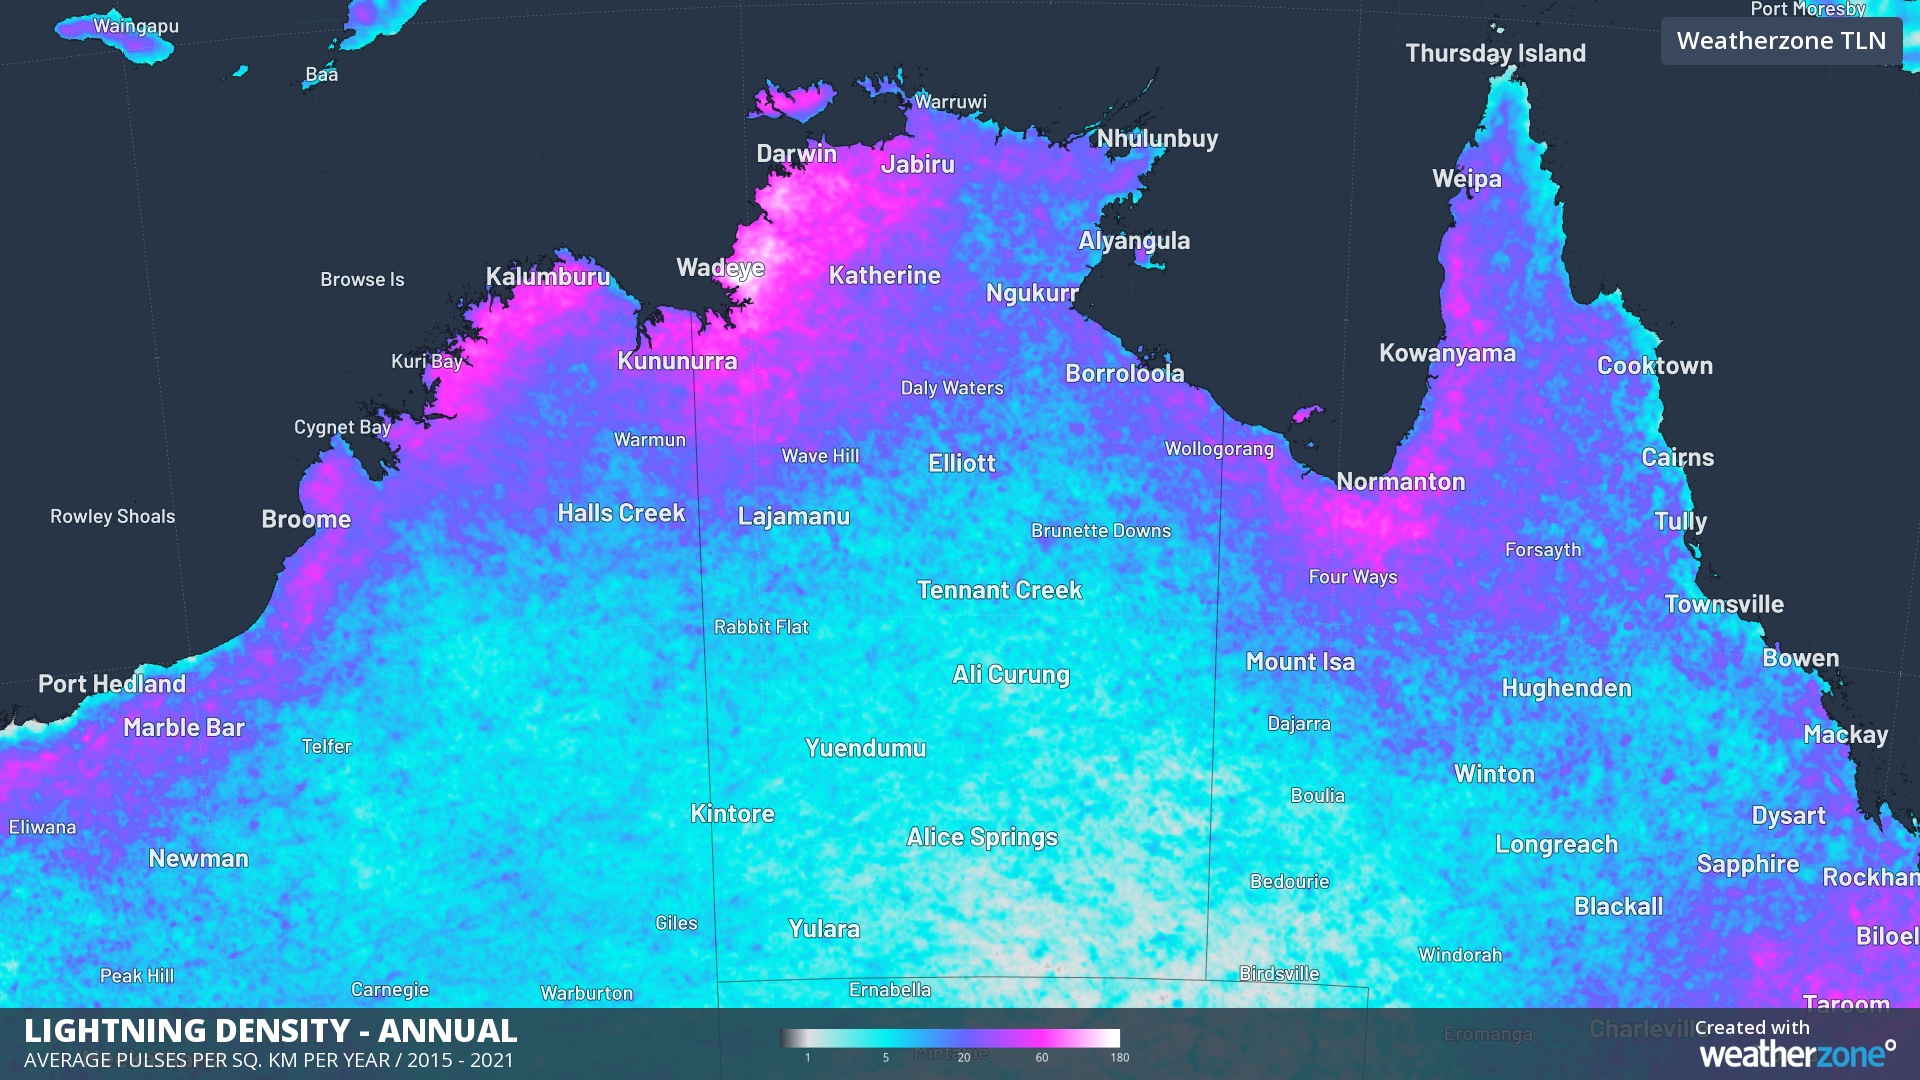
The map above also shows that Australia’s most lightning-active area, based on observations from the last seven years, is located over the western Top End, to the east of Wadeye. This region, which roughly lies over the Nganmarriyanga community, experiences close to 200 lightning pulses per square kilometre per year.
Of the capital cities, Darwin is Australia’s stormiest capital city, experiencing around 54 lighting pulses per square kilometre per year. This is followed by Brisbane (26), Sydney (18), Canberra (16), Melbourne (8), Perth (4), Adelaide (3) and Hobart (1).
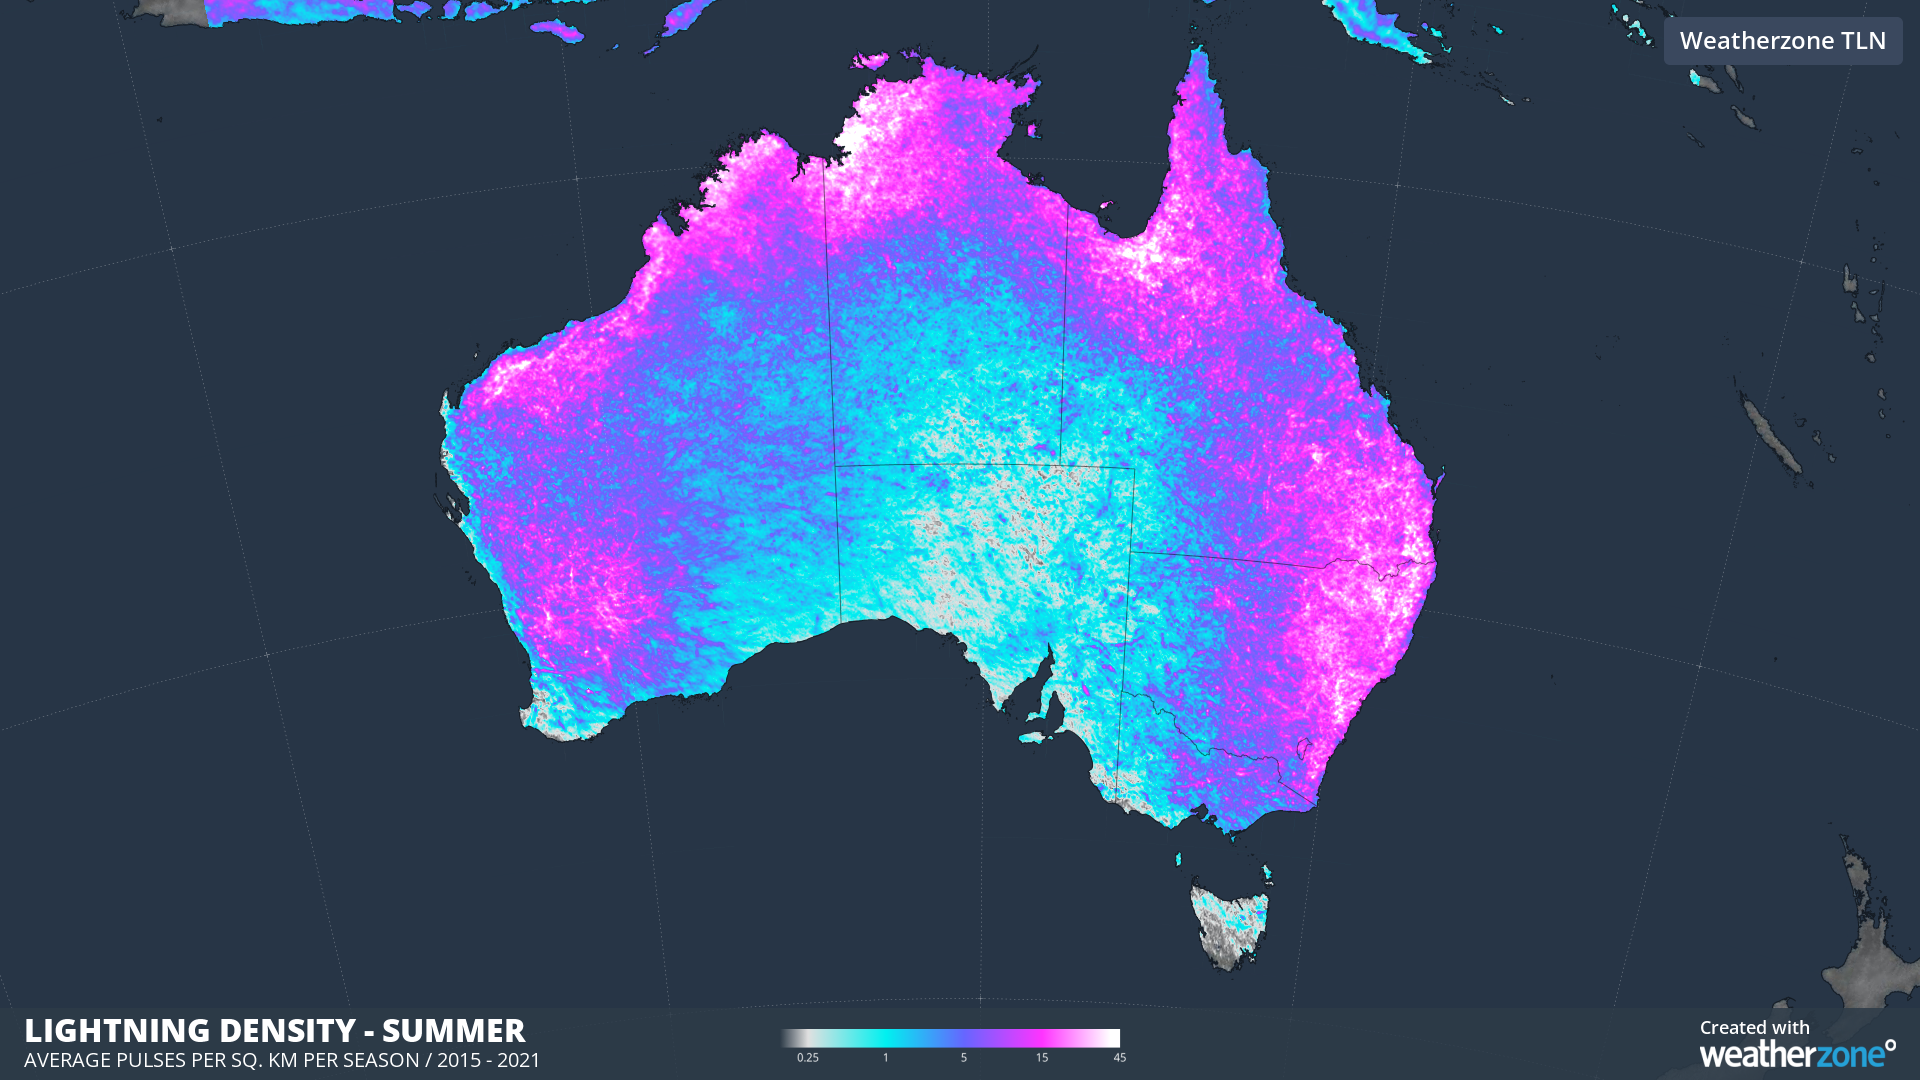
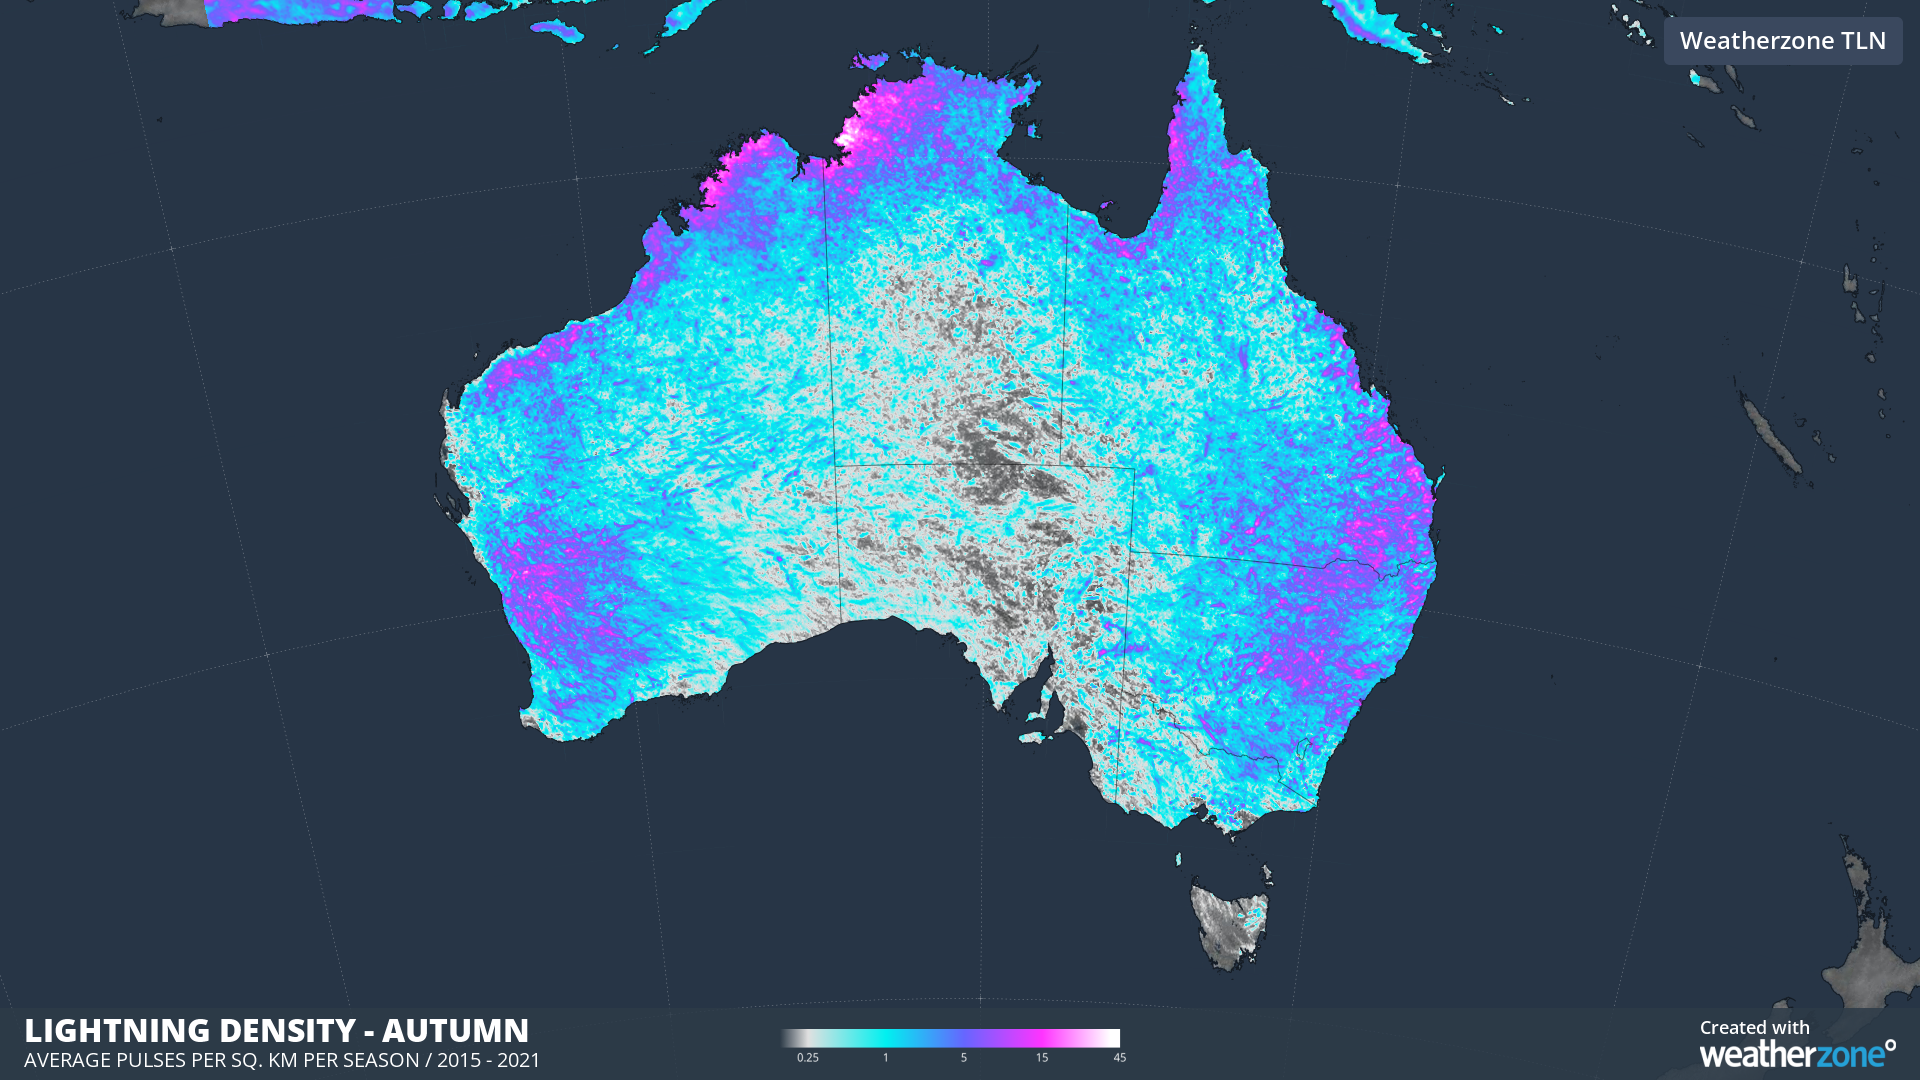
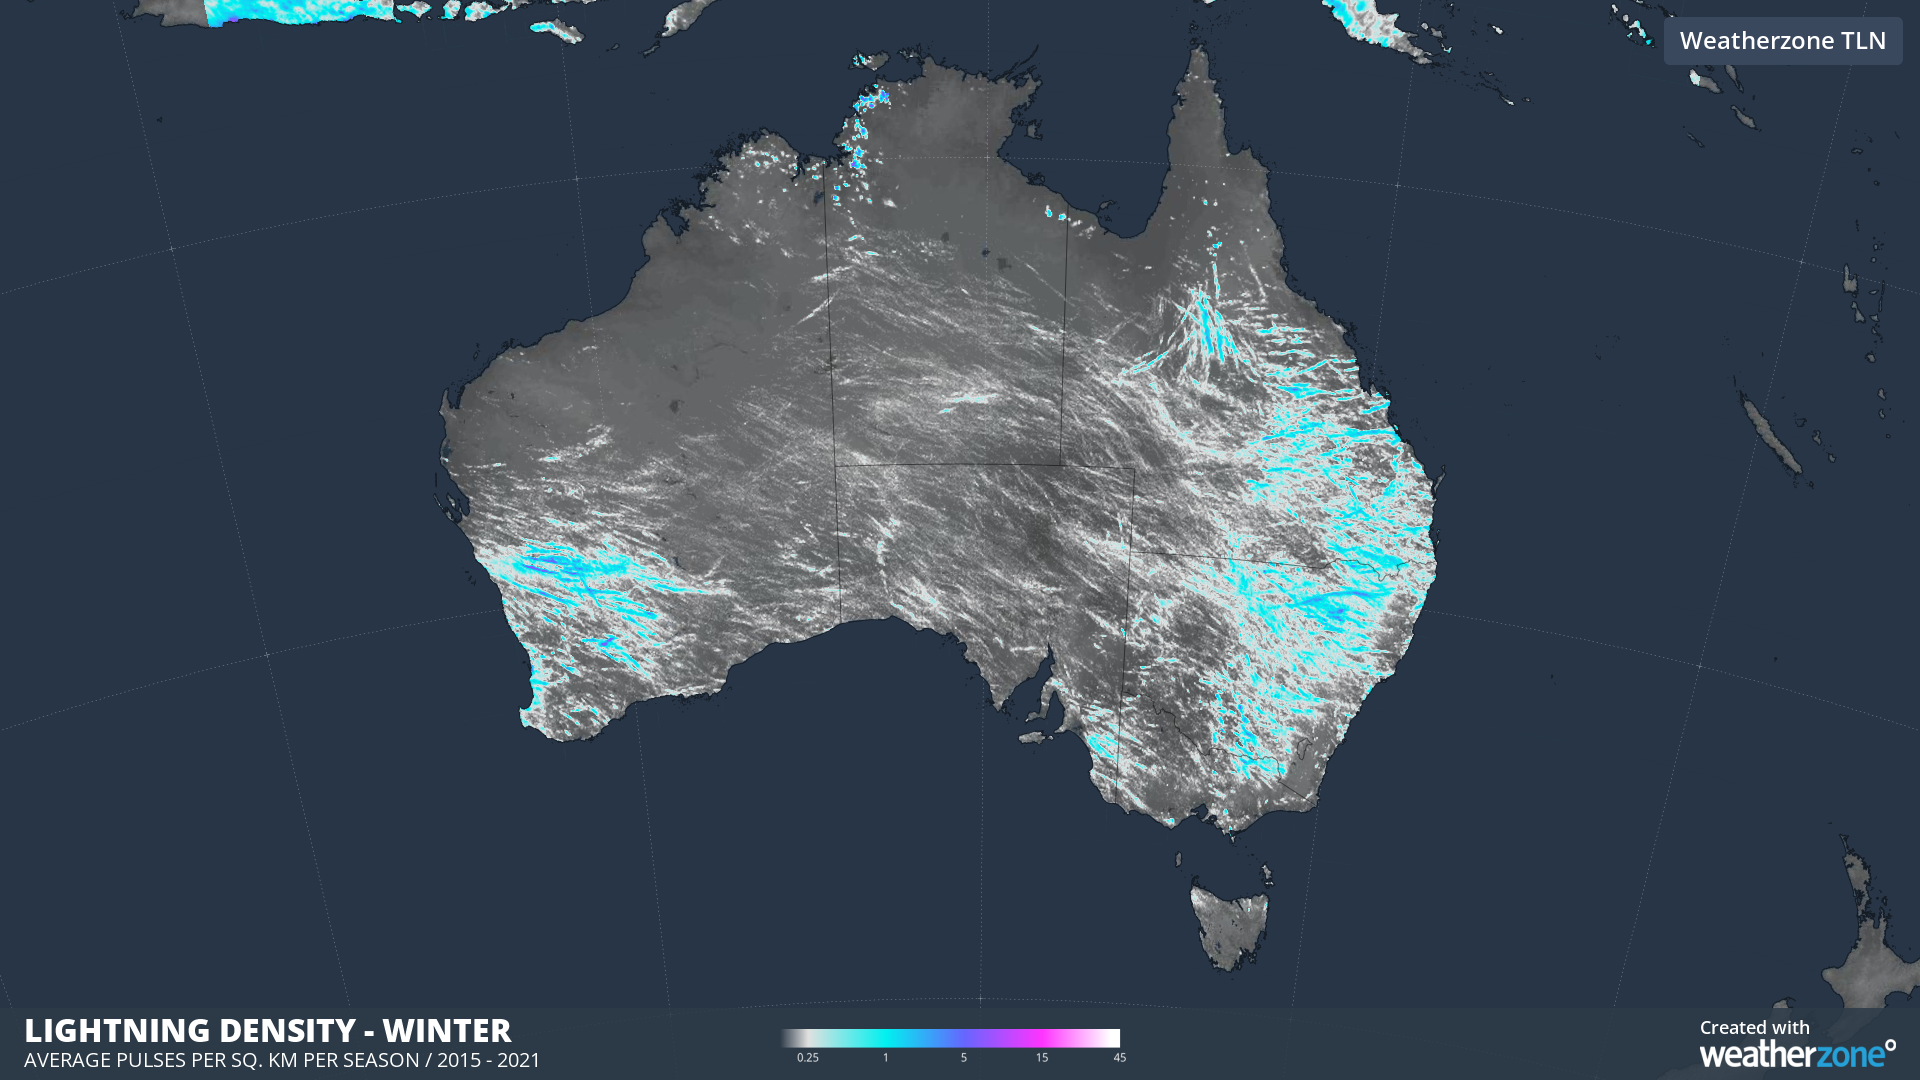
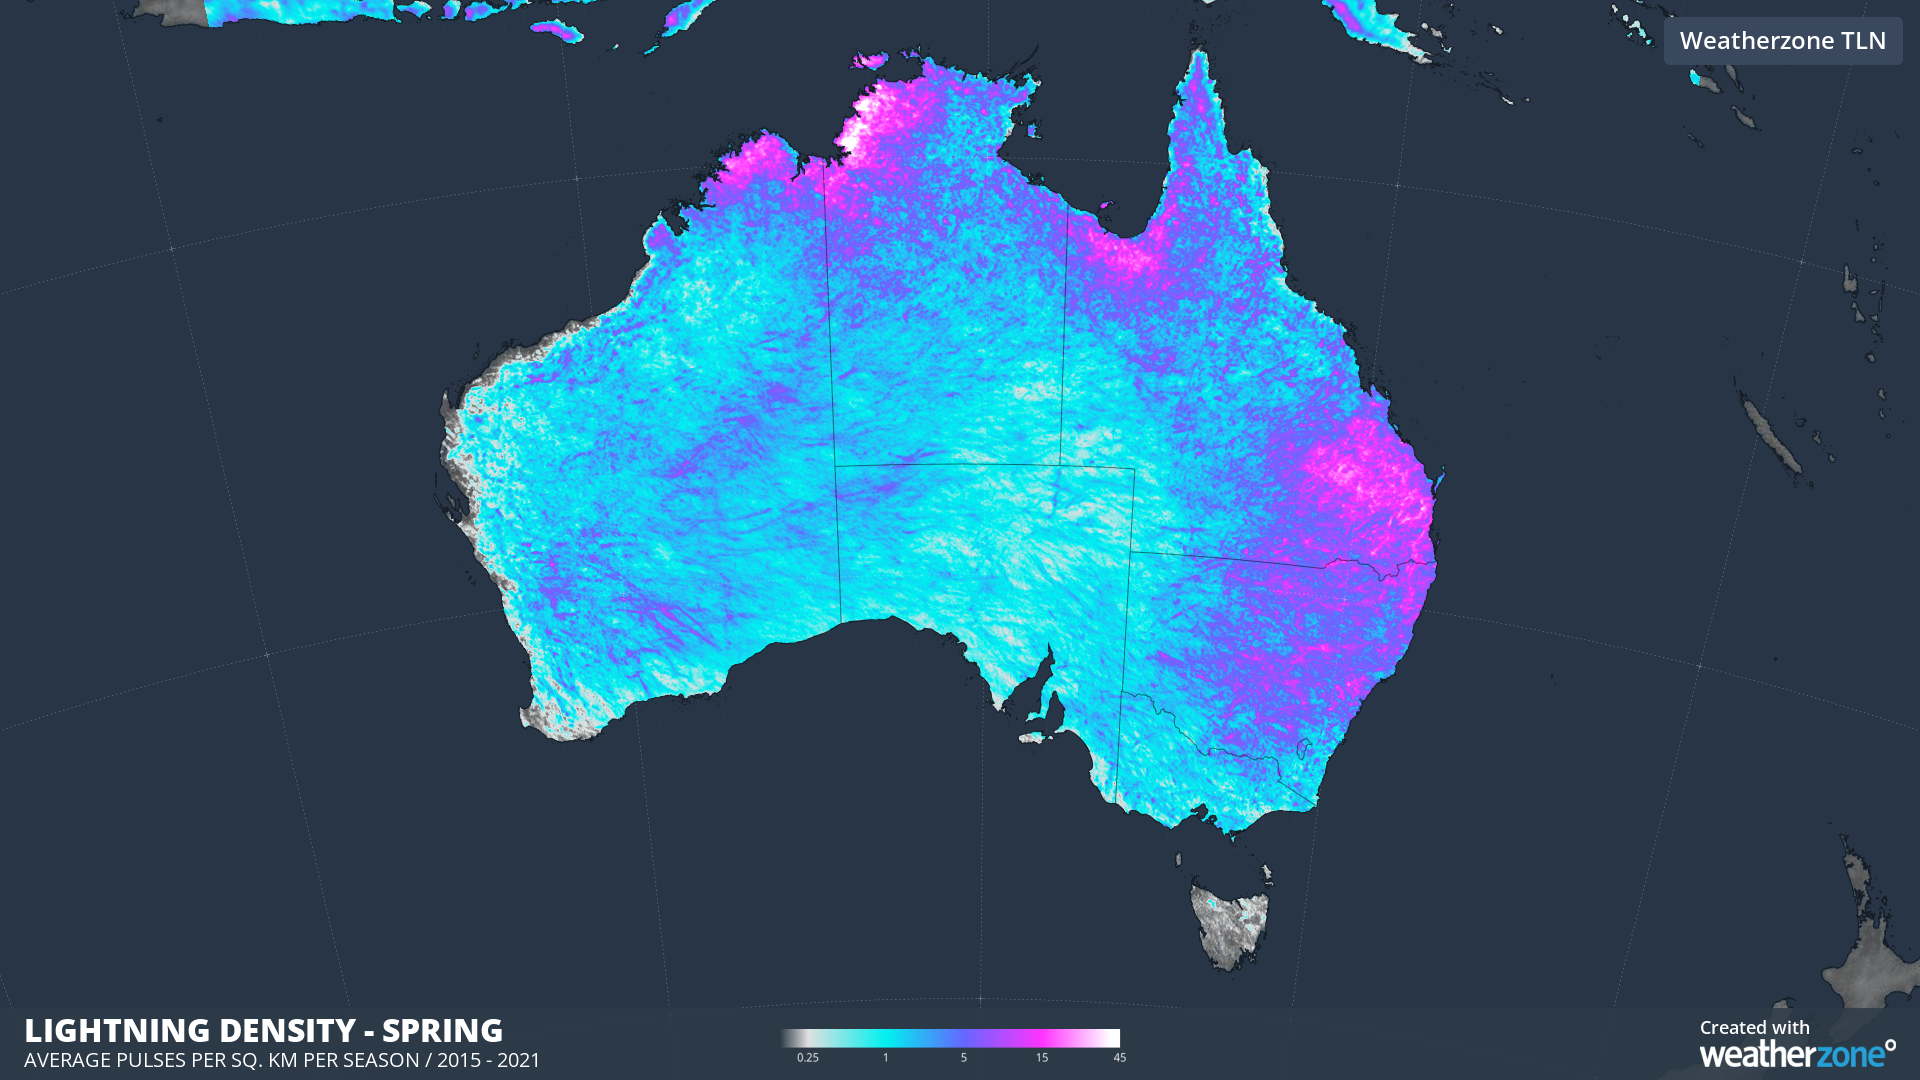
There is also a distinct seasonality to Australia’s lightning activity. The four maps below show how much lightning density changes, in both storm location and frequency, at different times of year.
Weatherzone’s real-time alerting system provides accurate lightning strike detection. Real-time and warning alerts are issued to any device across your business via SMS, email, web interface and our dedicated Weatherguard app. For more information, please contact us at apac.sales@dtn.com.


