
It happened. The year 2022 is now officially Sydney’s wettest since records were first kept at the Observatory Hill weather station near the southern pylon of the Harbour Bridge in 1858.
Just two days ago, we told you that Sydney only needed another 82 mm to surpass the total of 2194 mm which fell in 1950.
The old mark is now well and truly in the rear vision mirror (or whatever you can see out of the fogged-up rear-vision mirror in this eternally wet town anyway).
Up until 9 am this morning, Sydney was up to 2157.2 mm. So that meant only 36.8 mm to go.
As of midday, Sydney is only 15.2 mm away from notching up its wettest year in over 160 years of records. The current record is 2194 mm in 1950. pic.twitter.com/O3JViEis5o
— Andrew Miskelly (@andrewmiskelly) October 6, 2022
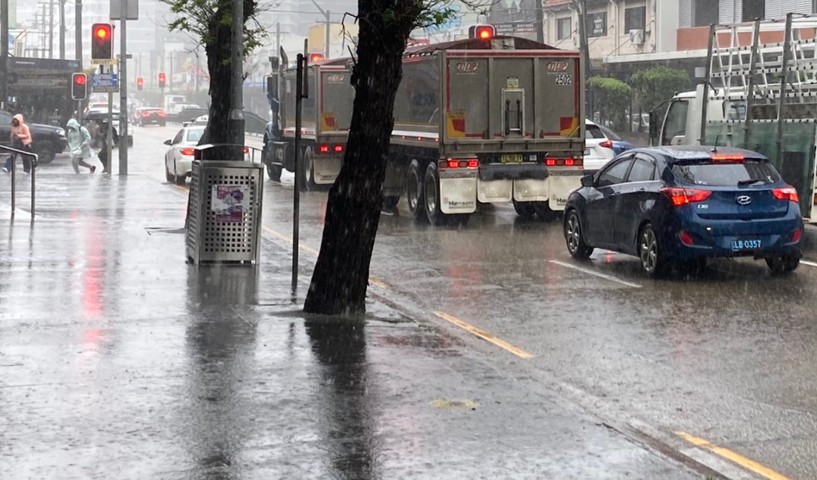
The mark was passed around lunchtime, and by 1:30 pm there was already in the 54.2 mm gauge on a very, very sodden and miserable Thursday, especially in coastal parts of the city.
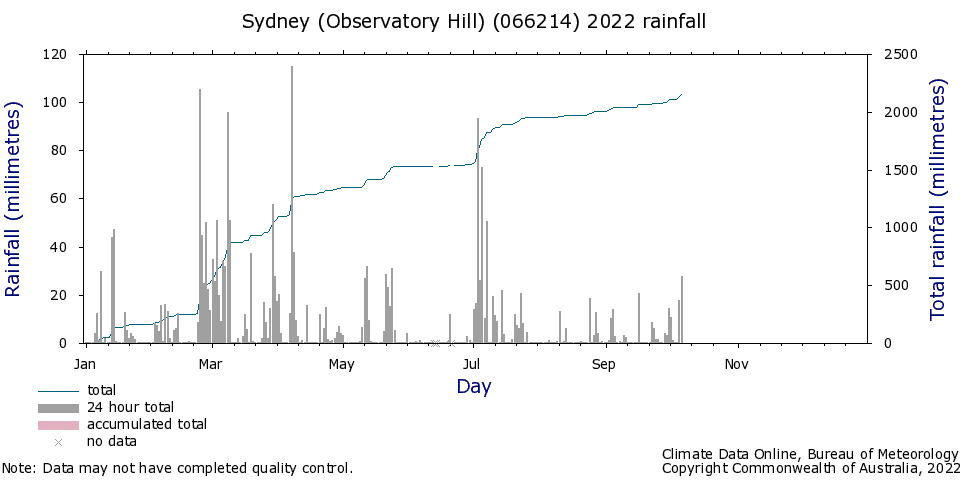
For those of you find so much rain a little hard to comprehend, here’s the graph showing every day of rainfall to date this year.
As you can see in the graph below, there were some monster days and months, but the remarkable thing is that there have been only very small gaps between significant rainfall events.
Unlike many Australian locations, Sydney’s rainfall is relatively evenly distributed throughout the year.
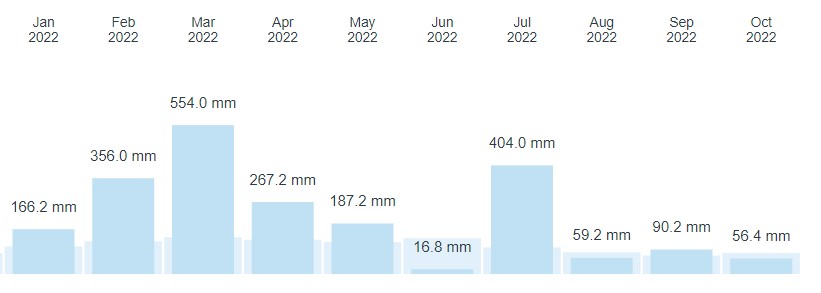
This year, with strong contributing influences from climate drivers like La Niña (twice), the heavy rain has barely eased off in any month except June, when just 16.8 mm was recorded.
You can see Sydney’s monthly rainfall in the graph below. The very pale blue underlying the light blue shows the average for the month, and you can find that graph for Sydney (or any location with a weather station) on our desktop site by scrolling down to the bottom of this page here.
More to come…




