
Parts of Western Australia have seen their heaviest day of August rainfall in over 100 years, as a deep stream of tropical moisture interacted with a cold front from Monday night into Tuesday.
This was the scene in a beachside car park at Geraldton, the large town with a population of 32,000 about 420 km up the coast from Perth.
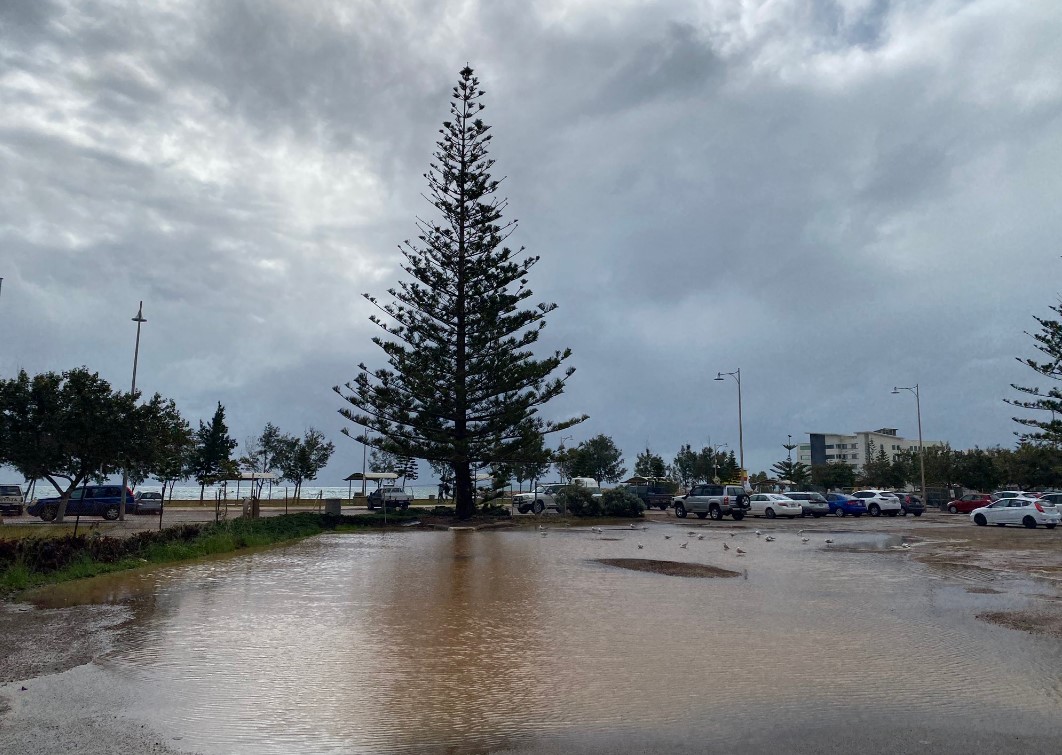
Image: Don’t wory Gero, beach weather will be back in a couple of days. Source: @Poynts.
The local who supplied us this image told us that he received 54 mm in his gauge while his dad, in the eastern suburb of Strathalbyn, received 72 mm.
Those were of course not official readings, but we can tell you that the 24-hour total of 61.6 mm at Geraldton Airport was officially a record for August.
Daily August rainfall records were also set at numerous locations in the Central West and Central Wheat Belt forecast districts, including:
- Jurien Bay (66.2 mm)
- Morawa Airport (46 mm)
- Kellerberrin 43.6 mm
- Wongan Hills 38.6 mm
- Northam 36.3 mm
Some other noteworthy falls included:
- Northampton had 64.6 mm, the heaviest August daily fall in 113 years
- Mullewa had 49.8 mm, which was also the heaviest August daily fall in 113 years.
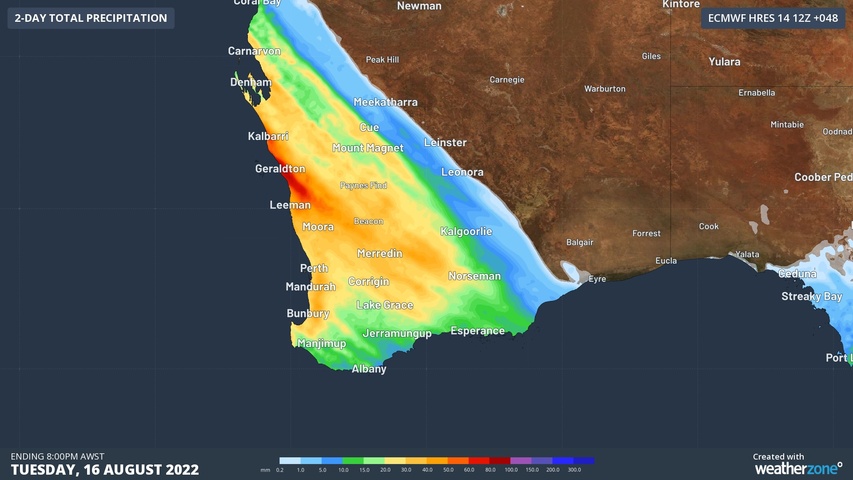
It’s worth taking another look at the rainfall prediction chart we published in our story on Monday about this rain event, as it shows that the heaviest rain was expected in the Geraldton area and so it proved.
As things stand on Wednesday morning as we write this story, a trough linked to a cooler and more unstable airmass behind Tuesday’s cold front is currently affecting the region.
Wild winds were also recorded early on Wednesday morning, strongest in the Perth area, with gusts including:
- A 96km/h gust at Swanbourne at 5.30am
- A 98km/h gust at Garden Island at 5.34am
- A 103km/h gust at Rottnest Island airport at 5.20am
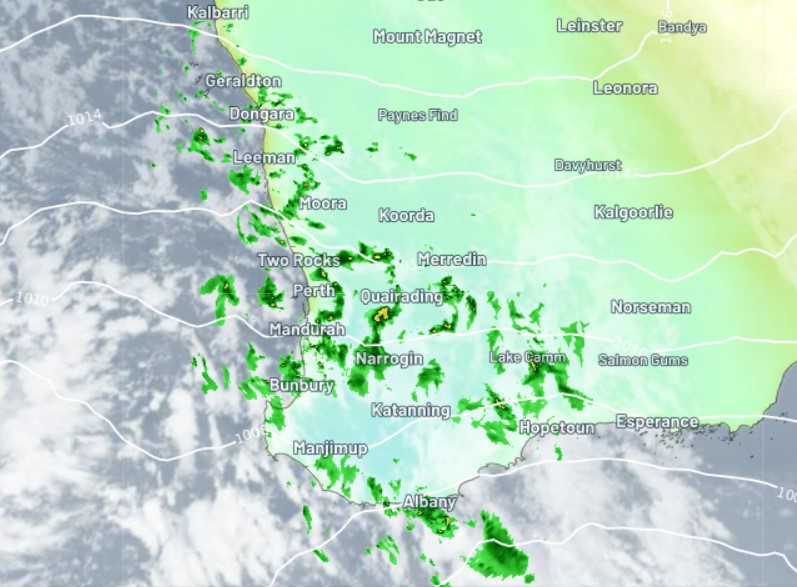
Meanwhile frequent heavy showers and severe thunderstorms are still whipping across southwest WA from Geraldton all the way south to Albany, extending a fair way inland as you can see on this morning’s radar image.
Record-breaking totals of the sort we saw a day or two ago are unlikely, and showers should start to clear across most districts by Thursday, including Perth.
However showers will stubbornly stick around Albany and the South Coastal forecast district for most of the week, which is not unusual. For more information about our thunderstorm and wind forecasting, alerting and tracking, please contact us at apac.sales@dtn.com.


