
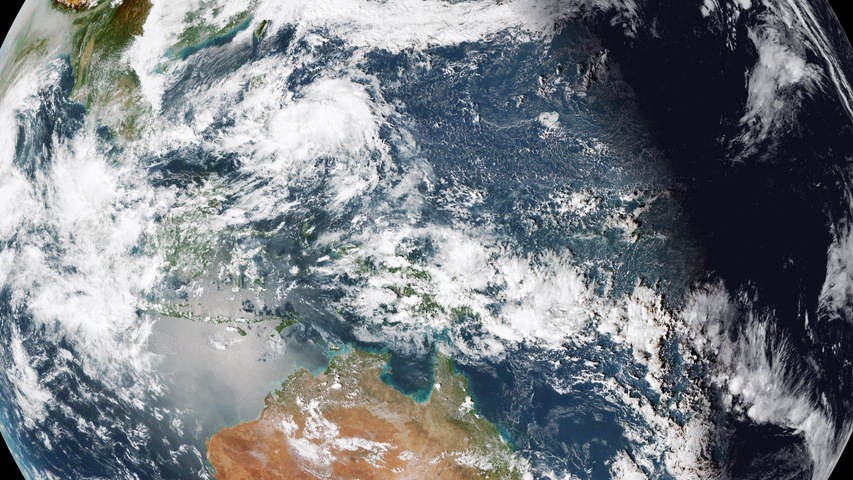
A significant moment in the timeline of satellite weather observations over Australia, Eastern Asia and the western Pacific will take place on Tuesday afternoon, when the Japan Meteorological Agency (JMA) transitions from Himawari-8 to Himawari-9 as the primary geostationary weather satellite over the region.
A geostationary satellite is one that is in geostationary orbit. As the name suggests, geostationary orbit allows an object to remain over the same point on the Earth’s surface as the planet rotates. To achieve this, the object must be stationed 35,786 kilometres out from the equator.
Geostationary satellites are particularly useful for observing weather, as imagery of the same area may be captured 24 hours a day. This allows for frequent updates and intuitive animations covering rapidly evolving phenomena like low pressure systems, thunderstorms and even bushfires.
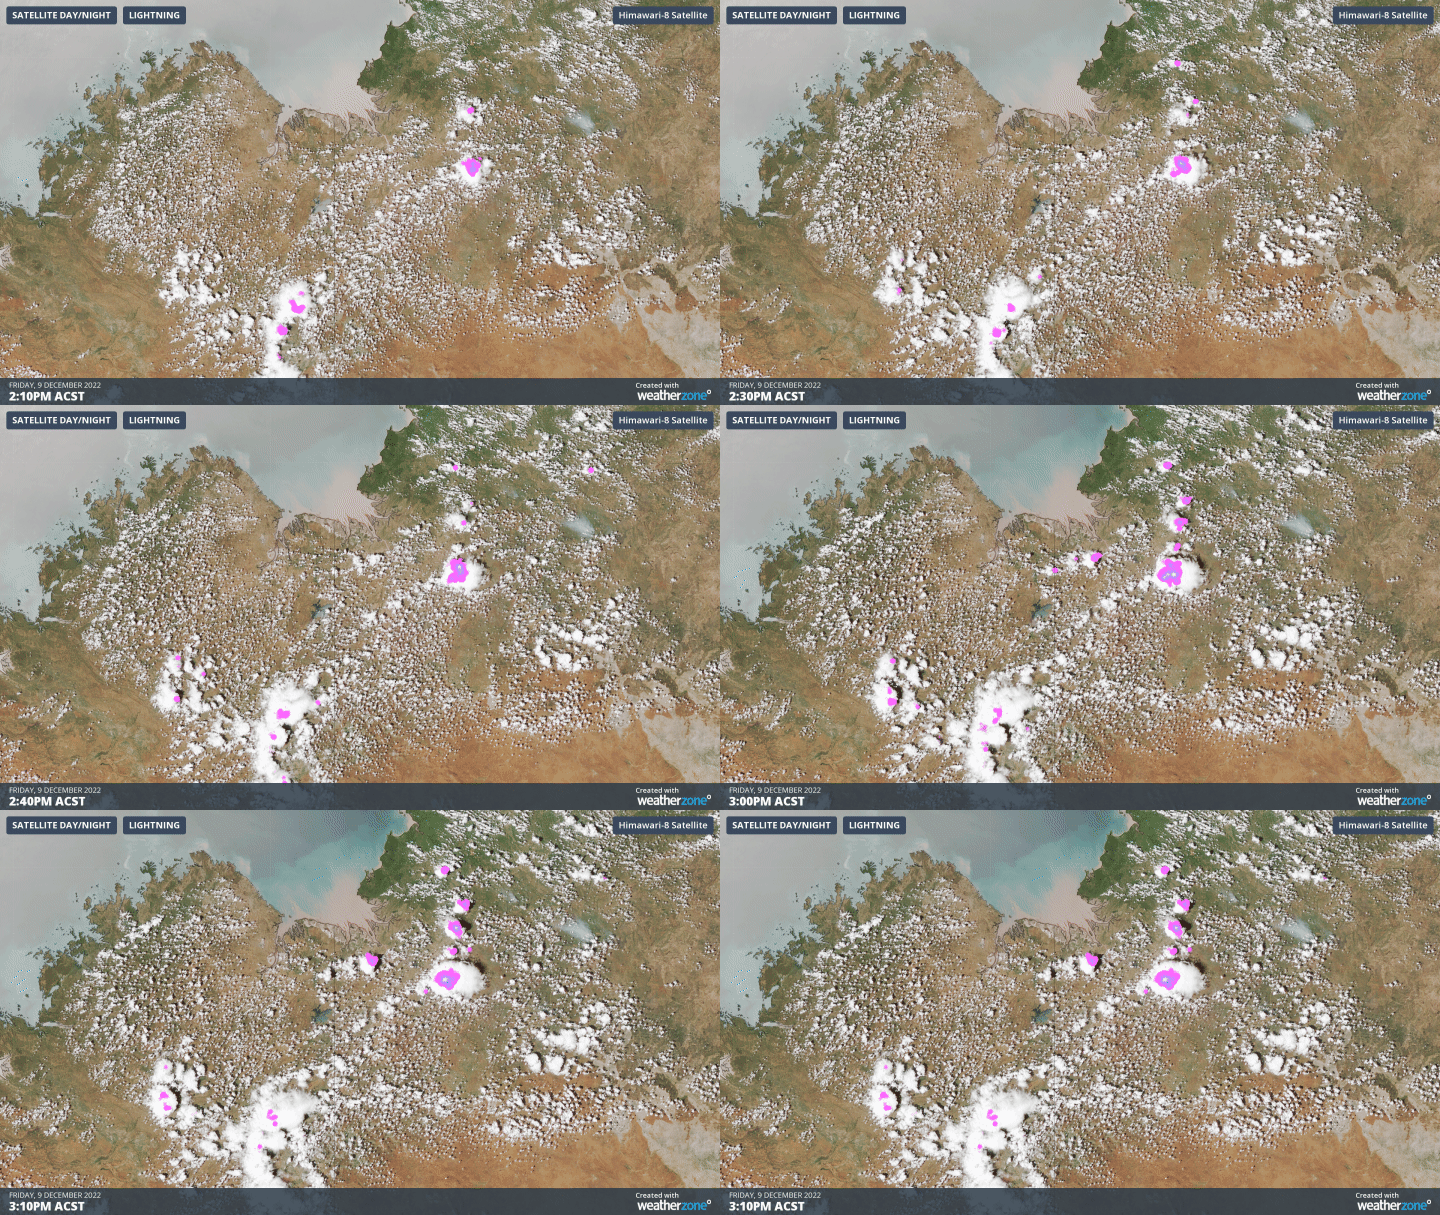
Image: Tracking the development of thunderstorms over northern Australia, using imagery from Himawari-8.
Weaknesses of geostationary satellites include a poor view of high latitude areas, and limited image resolution due to the remoteness of their orbit. Polar orbiting satellites closer to Earth fill these gaps, but they capture imagery in swaths which are visited only once or twice per day.
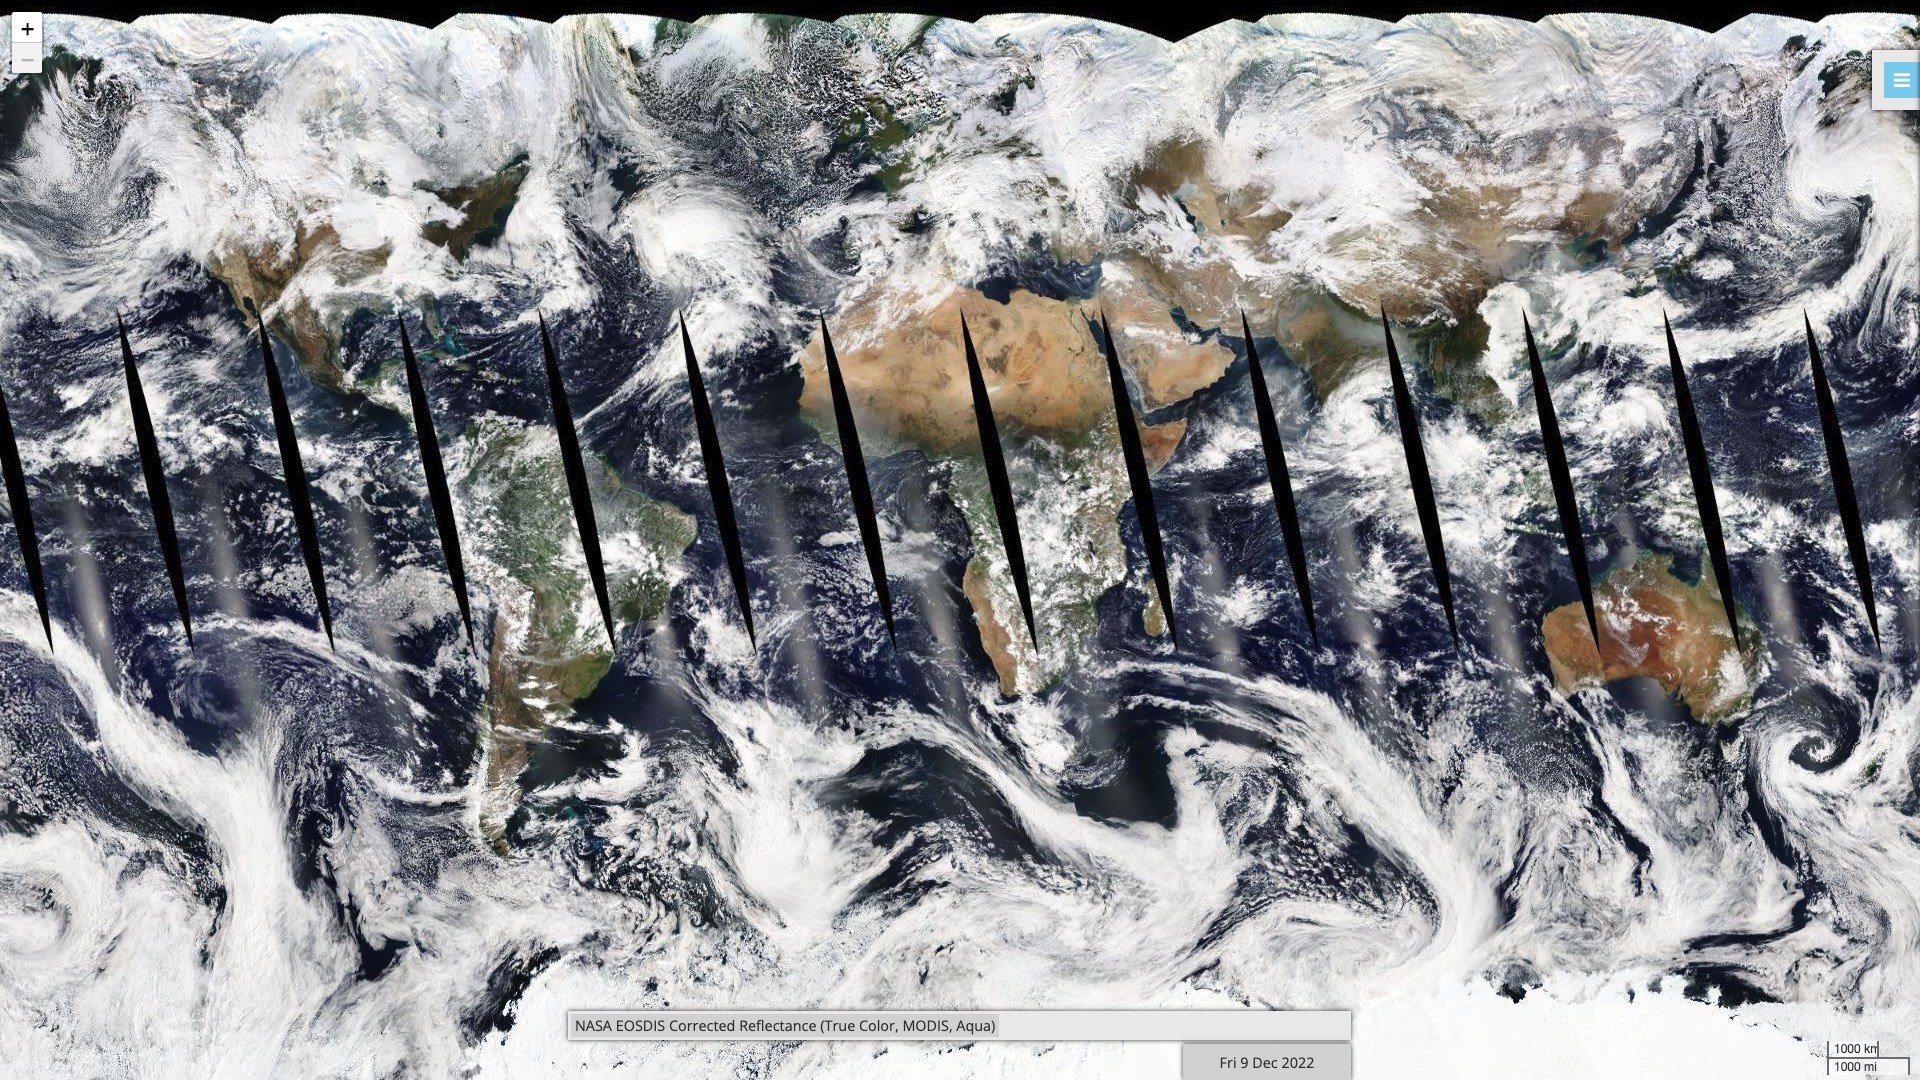
Image: Swaths of imagery captured by a NASA satellite in a sun-synchronous, low orbit.
Launched in October 2014, Himawari-8 became operational in July 2015, replacing the older Multifunctional Transport Satellites (MTSAT) series of satellites. Himawari-9 was launched in November 2016. Himawari-8 will take on standby status once Himawari-9 becomes the primary platform.
The Himawari satellites are stationed relatively close to each other, over a longitude of 140.7°E. They carry the same imager payload, known as the Advanced Himawari Imager (AHI).
The AHI captures observations at 16 different wavelengths, with spatial resolution (at the sub-satellite point) ranging from 500 metres (high-resolution visible band) to two kilometres (infrared bands) per pixel.
Full disk (the entire view available to the satellite) imagery is captured every 10 minutes, with several smaller regions able to be captured more frequently again. Some rapid-scanning regions can be centred on dynamic weather systems like tropical cyclones.
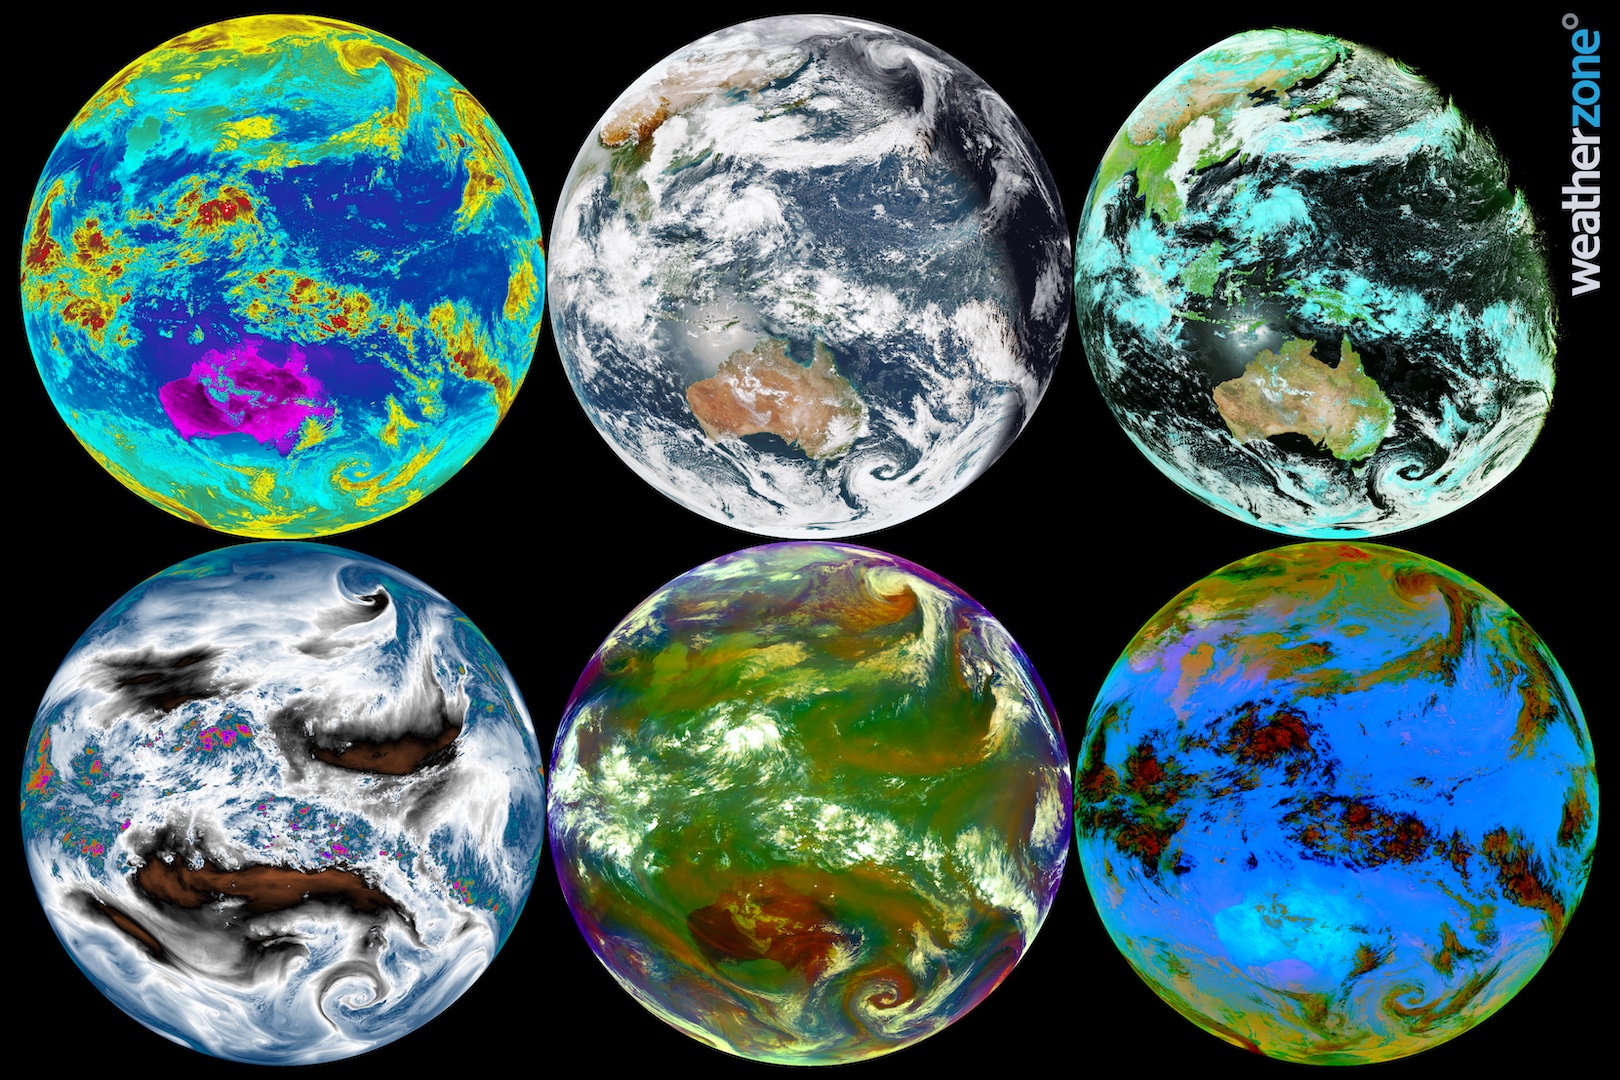
Image: A range of image products able to be created from the 16 bands captured by the Advanced Himawari Imager.
Tuesday’s transition should go unnoticed by most, thanks to careful planning and management by the JMA. A brief disruption to imagery is expected between 04:40 and 05:00 UTC (15:40 and 16:00 AEDT).
Himawari-9 is expected to remain in service beyond 2030, providing a wide range of benefits to operational weather forecasting, numerical weather prediction, disaster management, climate monitoring and research.
Imagery from the Himawari satellites may be viewed on the Weatherzone website.




