Unseasonably heavy rainfall is set to continue across parts of the Pilbara and Kimberley during the next 48 hours as a low pressure system sits off the northwest coast of WA.
The map below shows a thick northwest cloudband engulfing WA on Monday morning.

This cloudband and the associated low have brought widespread rainfall across parts of the Pilbara and Kimberley during the last 24 hours.
The Pilbara saw the largest 24 hour totals up to 9am on Monday, with Indee recording 138 mm, Sherlock to Indee’s west 125mm and Port Hedland Airport 86.2 mm.
During the next 72 hours, heavy rain will continue over parts of the Pilbara and Kimberley districts. The map below shows one model’s rainfall forecast between Monday and Wednesday.

Image: ECMWF accumulated rainfall forecast between Monday and Wednesday.
The heaviest falls are likely on Monday across parts of the northwestern Pilbara and the far southwest Kimberley. Six hourly rainfall totals should reach around 40-80mm in these areas, possibly reaching 80-120mm near the coast.
The map below shows the rainfall forecast for Monday by one computer model.

Image: ECMWF accumulated rainfall on Monday to 8pm WST.
Rainfall rates should gradually ease across parts of the Pilbara during the afternoon and the Kimberley by late evening as the low weakens and moves further offshore.
Despite rainfall rates easing later Monday, rain will continue in the region on Tuesday, with widespread falls of 30-60mm and isolated totals of 80-100mm.

Image: ECMWF accumulated rainfall on Tuesday to 8pm WST.
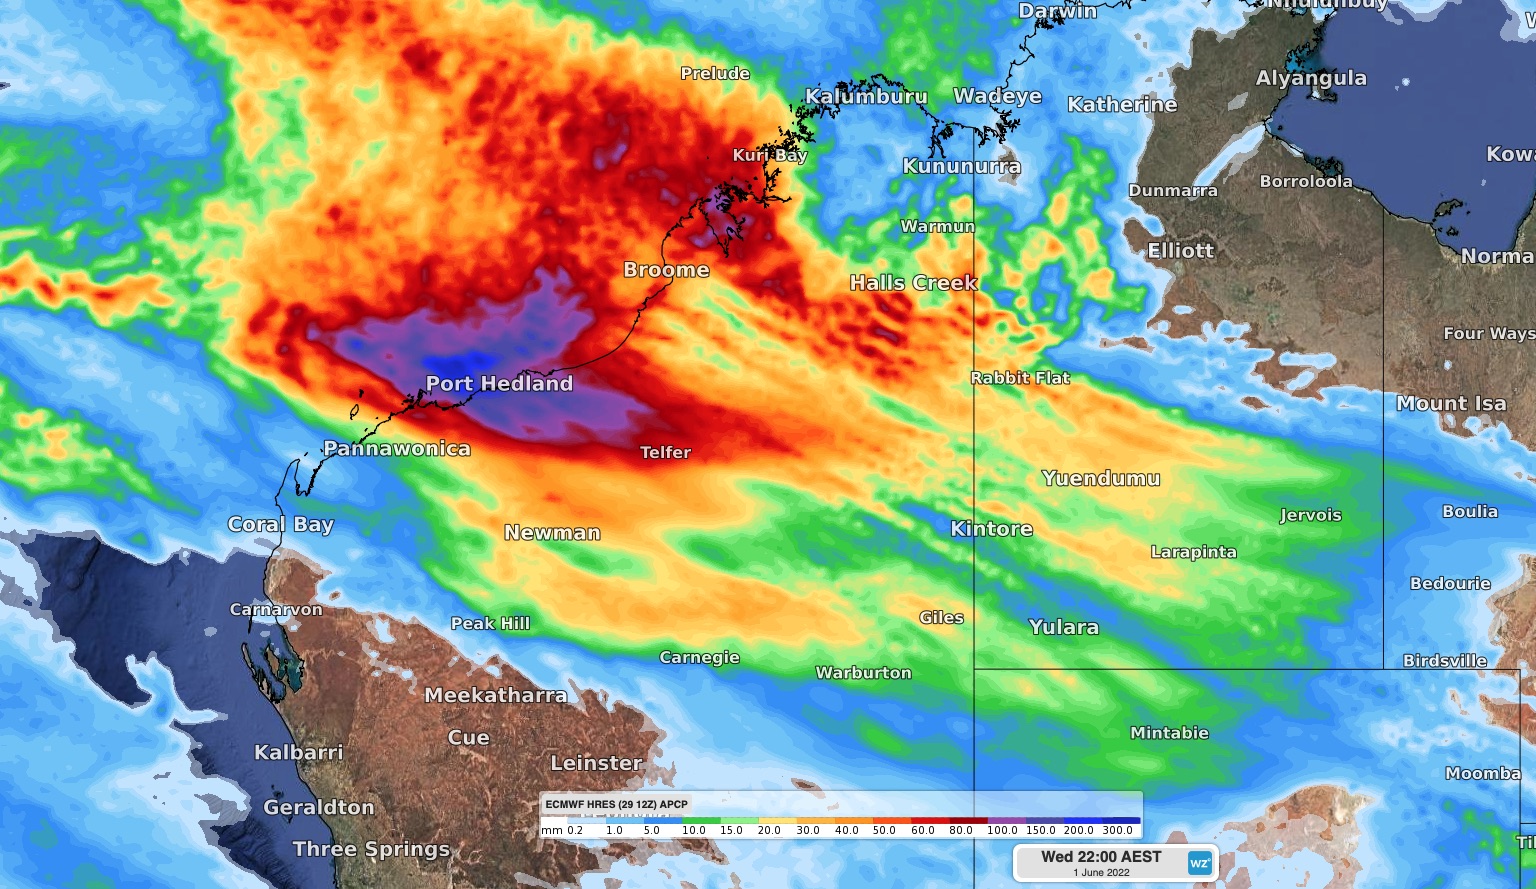
On Wednesday the rain will move further south and east, with the heaviest falls impacting the Kimberley and far northern parts of the Northern Interior.

Image: ECMWF accumulated rainfall on Wednesday to 8pm WST.
How can Weatherzone help?
Weatherzone has developed a flood risk system which accurately determines rainfall intensity at any given point along your mine site, catchment, road or railway.
The system uses radar technology which scans typically every 6-10 minutes, sending your business regular alerts or updates for your specific mine site or railway using geofencing technology.
Will the flood event subside, continue or worsen? The rainfall risk system is used in combination with Opticast™, an industry leading forecast system which forecasts rainfall intensity and accumulation at your location.
Weatherzone also provides businesses with long term rainfall forecasting solutions out to 6 months, which allows businesses to plan well in advance and reduce the impact on day-to-day operations. For more information, please contact us at apac.sales@dtn.com.


