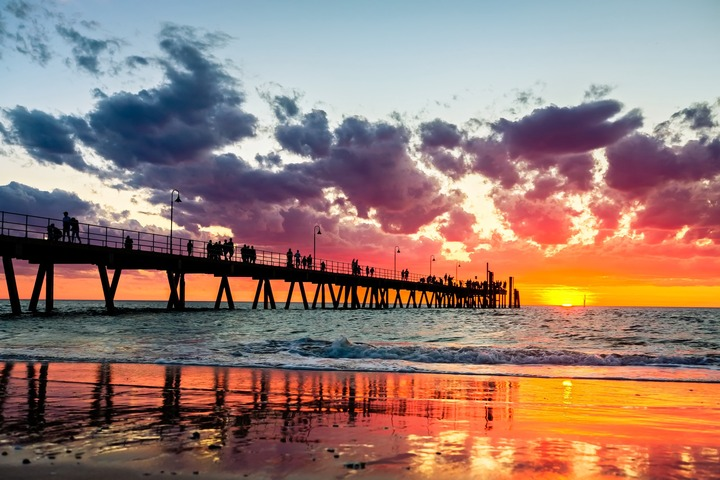
On Tuesday, South Australia basked in an unusually warm winter day dropping energy demand across the state.
It is rare to see a 26ºC day in Adelaide during winter, but that’s exactly what happened on Tuesday as the state sweated in summer-like warmth during the final week of winter.
An unusually warm air mass for this time of year swept into SA on Tuesday, sending temperatures 11 to 12ºC above average in some parts of the state.
Adelaide also had its warmest winter day in 14 years after the city reached 26.4ºC just after midday. This was more than 10ºC above average for August and close to Adelaide’s mean maximum temperature in December, which is 26.9ºC.

Image: Surface air temperature on Tuesday afternoon, according to the ECMWF-HRES model.
The pleasant temperatures plunged SA’s operation demand to 548.38MW at 1:40pm on Tuesday, August 29, according to AEMO.
However, it didn’t quite meet the record low negative demand of -46 MW which was set on Sunday, November 21, 2021.
The negative demand was caused by more electricity being generated than what is required in the network. The growth of rooftop solar in SA has contributed to the negative demand events that have occurred in SA in recent years.
According to SA Power, in the next 5-10 years, we expect to see SA’s energy needs during the middle parts of the day regularly being supplied 100% from rooftop solar.
Negative demand is usually caused by mild temperatures between 20 and 24ºC and sunny conditions.
However, on Tuesday, many places in SA experienced their warmest winter day in 16 years, including Cleve Airport (27.3ºC), Kingscote (23.1ºC), Strathalbyn (26.2ºC), Kadina (26.8ºC), Cape Willoughby (21.2ºC), Edithburgh (26.9ºC) and Mount Crawford (22.2ºC).
The warm airmass was dragged across the state by gusty northerly winds ahead of a cold front which arrived in Adelaide during the late afternoon.
The windy conditions yielded significant wind power across the wind farms in SA in the afternoon, with wind power contributing 86.4% to generation, according to OPENNEM.
The satellite image below shows clear skies across much of the state on Tuesday ahead of the cold front.
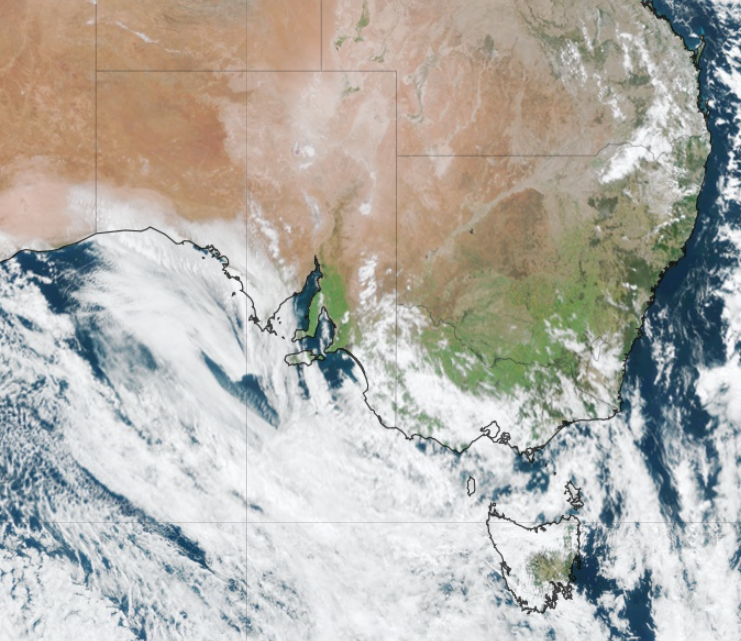
Image: Satellite image captured by the Himawari-8 satellite at 11:10am CST ON Tuesday, August 29
The solar power generation peaked in the morning contributing 59.2% to the energy generation at 11:30am.
The maximum renewable energy contribution occurred at midday with 97% of clean energy being generated for SA’s grid. The large renewable contribution was despite the solar and wind power peaks occurring at different times of the day.
Much cooler southwesterly winds spread across SA from Tuesday evening behind the cold front. This cooler air will make Wednesday around 10ºC cooler than Tuesday in many parts of the state increasing energy demand once more.
Solar Forecasting and Generation
Weatherzone partners with Solcast – the world leader in real-time actuals and rapid-update solar forecasts.
Utilising Solcast’s satellite fleet, sky-imagers and the SCADA data collected from your solar farm, you will acquire not only forecasting capability, but a precise picture of your actual yield and PR. Specifically built to ensure you meet the requirements of the AEMO and reduce your exposure to costly penalties.
Wind
Utilising Opticast’s data, we provide wind power generation, operational and severe weather forecasting to improve your planning and protect your valuable staff and assets. Utilise generation forecasts for individual wind farms, state level and the NEM at daily and hourly resolution.
Weatherzone’ Total Lightning Network ensures your wind farm is protected from severe storms by an alerting system that can be configured to your exact requirements, aligning with local site needs, procedures and legislation. For more information, please contact us at apac.sales@dtn.com.


