
After a lull in the winds this week, wind power is set to pick up from rock bottom as a rare easterly wind surge impacts Qld, NSW and SA.
Wind power has been slack this week across the National Electricity Market (NEM) in response to a stubborn high-pressure system which has parked itself over the Bight.
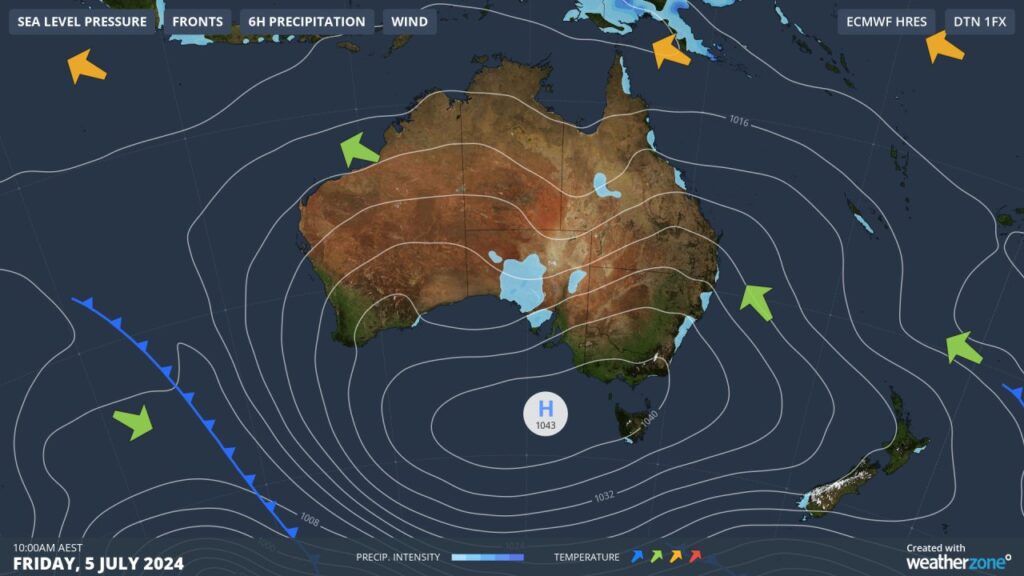
Image: Mean Sea Level Pressure (MSLP) at 10am on Friday, July 5
This high will continue to sit over the Bight and Tas, until it finally moves east into the Tasman Sea on Monday, July 8.
The image below shows that we saw low wind power in the order of 30 to 60 GWh/day in response to this high earlier this week, but wind has picked up slightly to 100 GWh/day on Thursday, July 4.
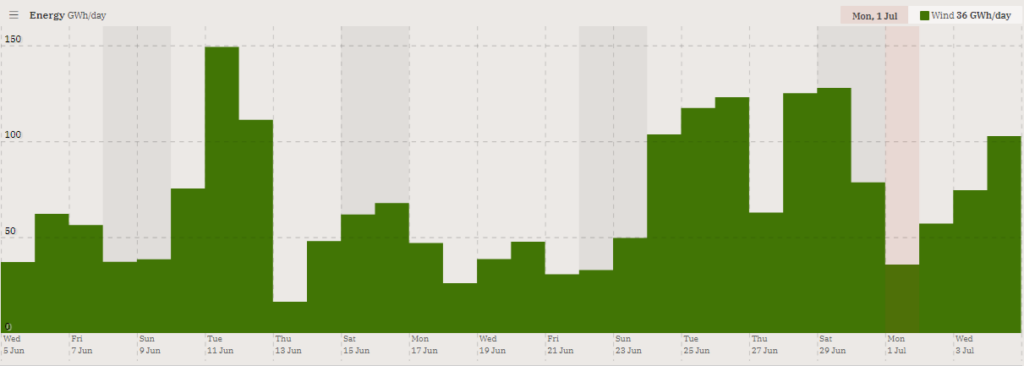
Image: Wind contribution to generation (GW) during the last 30 days leading up to Thursday, July 4. Source: OpenNEM
Usually with high pressure sitting over the Bight, wind power should continue to be low into next week.
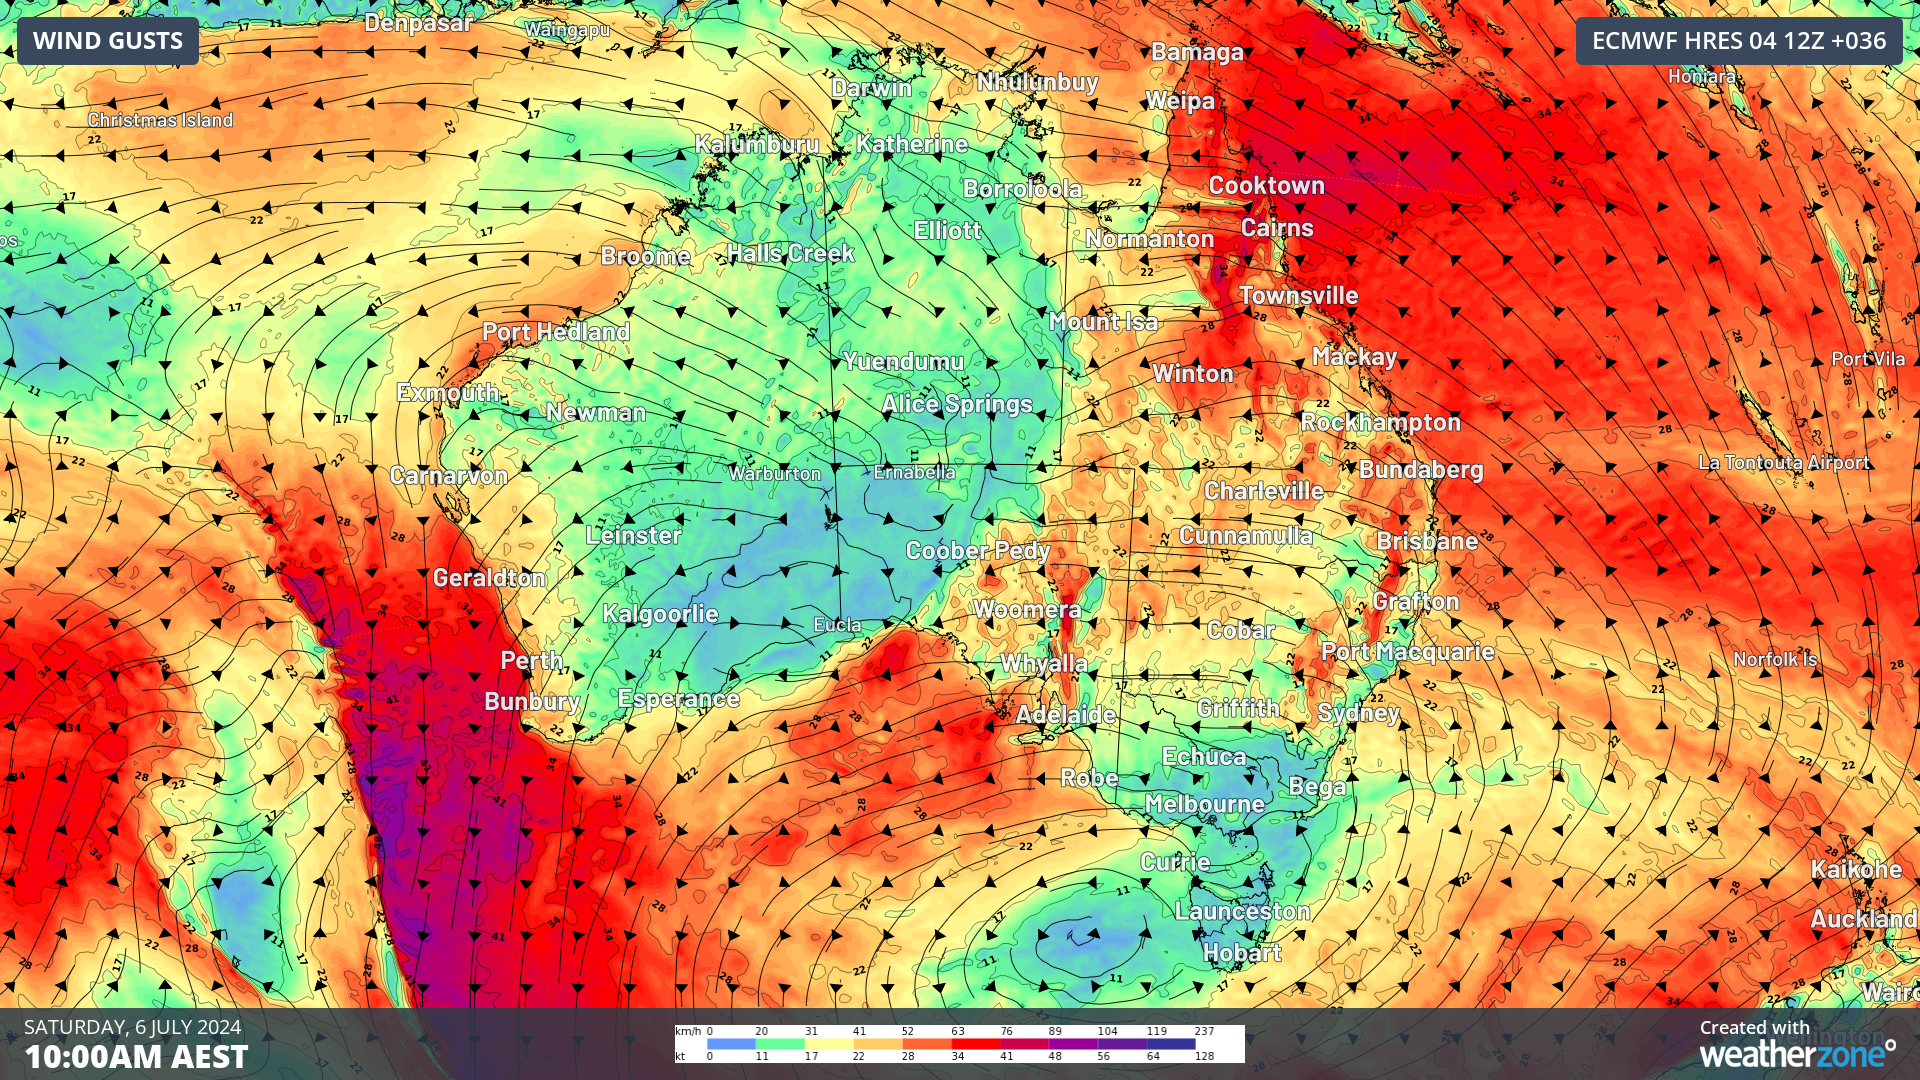
However, the images below show a rare easterly wind surge elevating winds slightly across parts of Qld, NSW and SA from Friday and possibly Vic on Monday.
Images: Instantaneous wind gust forecast between Friday, July 5 and Thursday, July 11
While it is common for easterly winds to move over Australia, it is the strength of the wind that is unusual. The strongest winds over southern Australia, typically originate from the north or south, while for the east coast, westerly winds are typically the strongest.
These winds are normally associated with cold fronts sweeping over the country. This weekend we will see easterly winds strengthen as they feed into a cut of low over SA cradled by a high-pressure system in the Bight.
The easterly wind surge will not match the strength of winds associated with cold fronts, so wind power will remain low to medium across Qld, NSW. In South Australia, wind speeds over the weekend should be strong, especially about the Flinders Ranges and western slopes from Saturday morning. As of 2:50pm Friday, there is a damaging wind warning out for these areas. Wind farms near Port Augusta could see winds reaching 90km/h from Saturday morning, with the potential for cut outs.
The image below shows that the wind farm output across the NEM should increase ever so slightly in the coming days, compared to the very low winds we saw earlier this week.
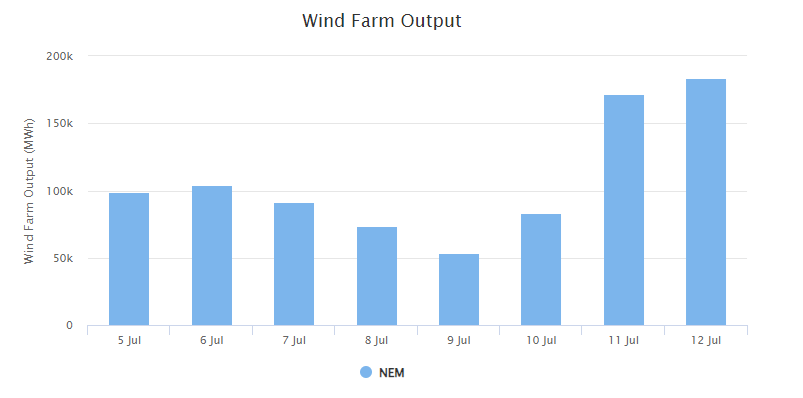
Image: Weatherzone’s Opticast Wind Farm Output for the NEM from Friday, July 5 to Friday, July 12.
The stronger easterly winds in these states, will also be accompanied by a thick northeasterly cloudband stretching from the Coral Sea down to SA. You can see in the image below that it has already begun thickening up and producing rainfall in these areas.
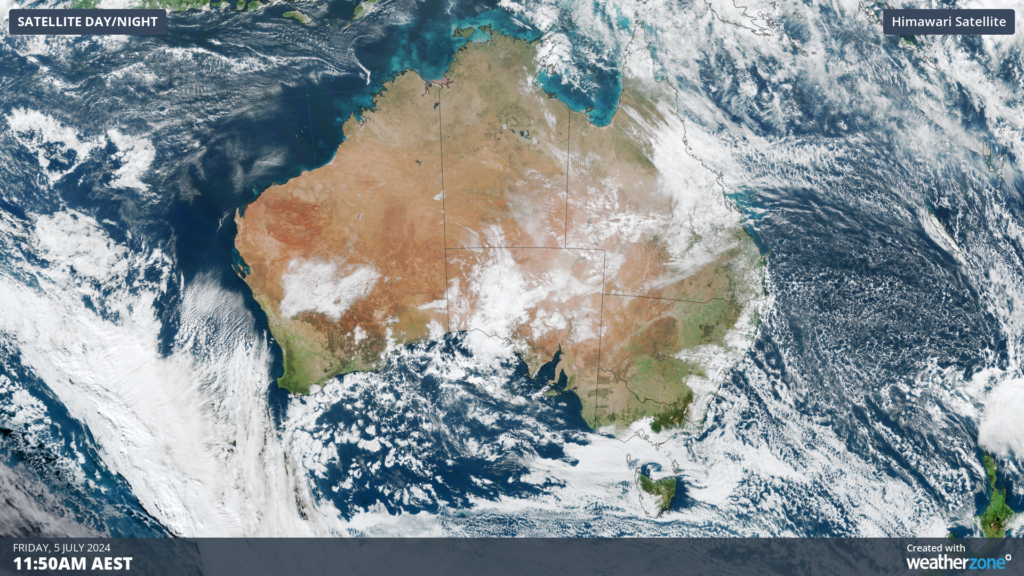
Image: Himawari-9 satellite image at 11:50am AEST on Friday, July 5
This cloudband is likely to reduce solar output in these states between Friday and early next week.
So, when is decent wind power coming?
You can see in the image above wind power is forecast to increase above 150 GWh day later next week in the NEM, with strong cold front finally able to make its way across southern Australia.
Utilising Opticast’s data, we provide wind power generation, operational and severe weather forecasting to improve your planning and protect your valuable staff and assets. Utilise generation forecasts for individual wind farms, state level and the NEM at daily and hourly resolution.
Weatherzone’ Total Lightning Network ensures your wind farm is protected from severe storms by an alerting system that can be configured to your exact requirements, aligning with local site needs, procedures and legislation. To find out more, please visit our contact page or email us at apac.sales@dtn.com.




