
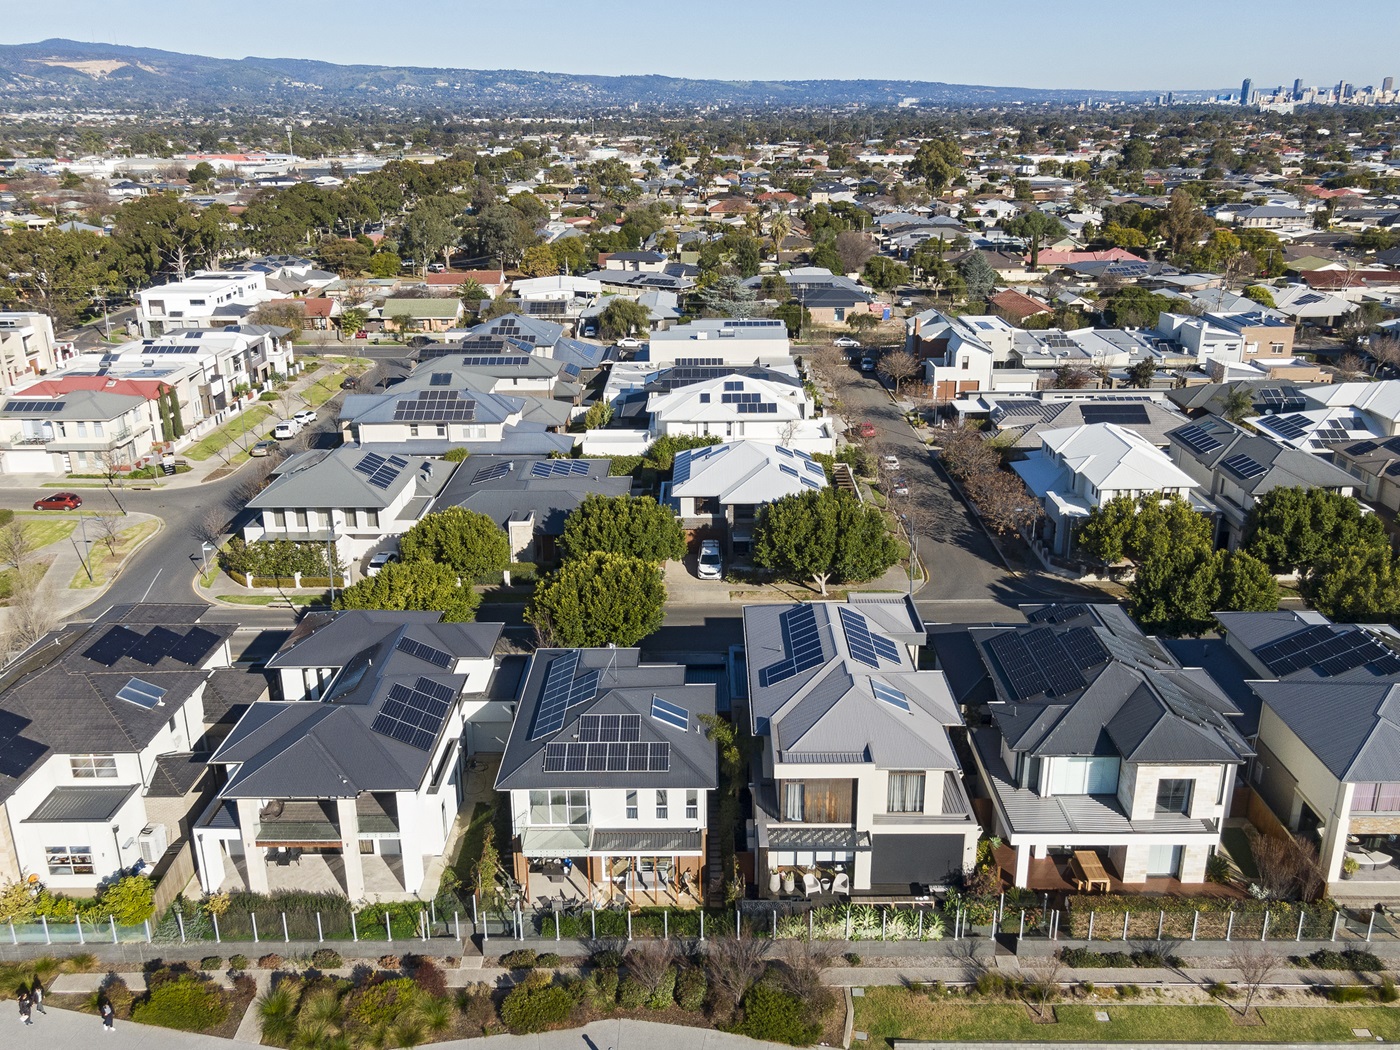
Southern Australia saw an abundance of clear skies during March, causing rooftop solar to soar to new heights.
The run of sunny days was caused by blocking high pressure systems that prevented cloud and rain bearing cold fronts from sweeping across southern Australia.
The clear skies led to Melbourne recording its driest March on record with a measly 2.8mm total, beating the previous record of 3.7mm in March 1934. Adelaide was also dry, recording 27 days without a drop of rain, while Sydney picked up 52.5mm of rain and Brisbane 152.8mm.
Across the four major NEM capital cities:
- Melbourne saw its sunniest March in 18 years, with an average of 8.5 hours of sunlight each day.
- Adelaide recorded the sunniest March since 1994, averaging 10.4 hours of sunshine per day.
- Sydney observed an average of 7 hours of sunlight per day, which is the most sun hours the city has seen in two years.
- Brisbane was the cloudiest of these cities with only 5.7 hours of sunshine on average per day, consistent with above average rain falling in the city.
The lack of cloud and rain across southern Australia led to increased rooftop solar output across the region in March 2024.
Data from OpenNEM shows that rooftop solar in Victoria was the highest on record this March since rooftops installations begun in 2007. The graphs below show the warm season rooftop solar contribution to the National Electricity Market (NEM).
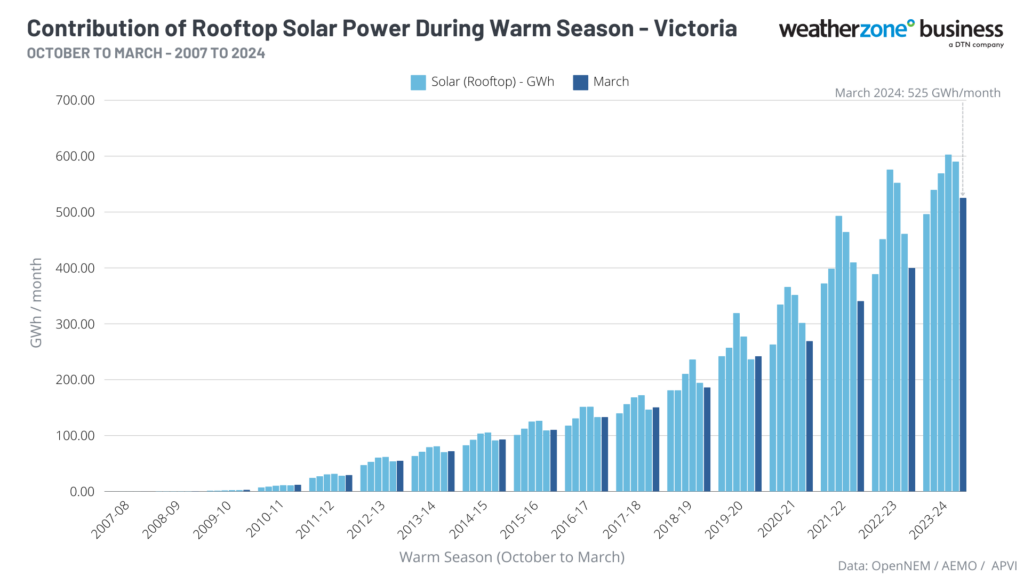
Images: Warm season (October- March) rooftop solar power (GW/h). Data sourced: OpenNEM, AEMO, APVI.
The rising trend in the graph above for VIC looks remarkably similar for SA, with March 2024 producing 294 GWh / month across the state, compared to 252 GWh / month from March 2023.
The graph also highlights that the total solar generation has been increasing year-on-year since 2018, driven by a boom in solar installations across Australia.
The Clean Energy Council reported that in 2023, renewable energy supplied a record 39.4% of Australia’s electricity, led by wind’s 13.4% share. Rooftop solar cracked a 10% share for the first time, reaching 11.2% ahead of solar farms at 7% and hydro’s 6.5% share.
During March 2024, rooftop solar across SA supplied 24.5% of SA’s energy needs, the largest in the NEM. Meanwhile renewable energy contributed 77% of SA’s power, with wind taking the lead with a 43.5% contribution.
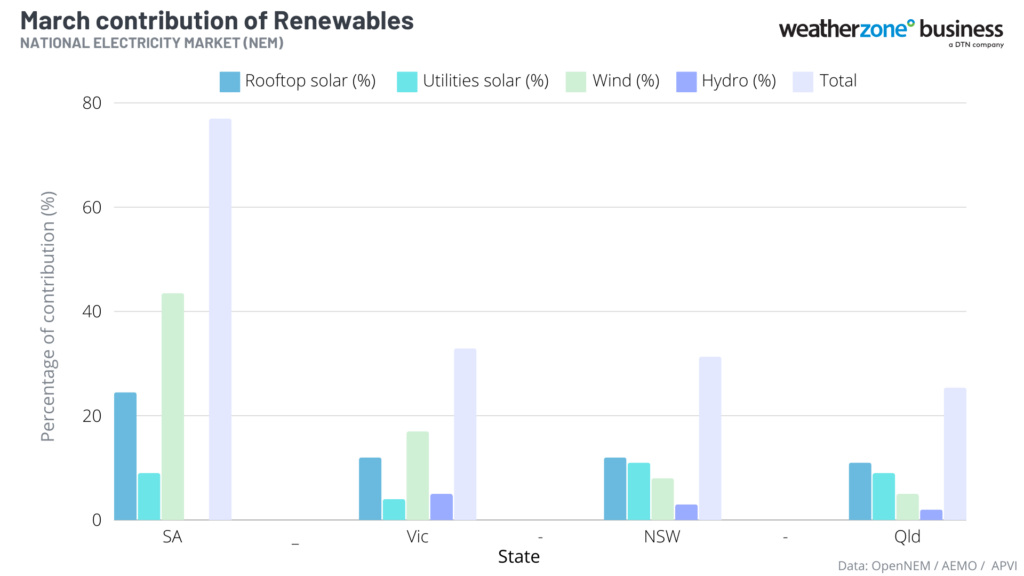
Image: March contribution to renewables in SA, Vic, NSW, Qld, Data sourced: OpenNEM, AEMO, APVI.
Rooftop solar is the leading renewable across NSW and Qld, contributing between 11 and 12 percent to the state’s energy needs, followed by solar farms then wind.
Weatherzone Business and Solcast are a market-leading partnership delivering highly specialised solar data to the Australian renewable energy industry.
Designed for utility scale solar sites, we offer you a globally proven solution.
With low upfront CAPEX and powerful cloud-based information systems, you can access a complete suite of irradiance and weather data to ensure forecast accuracy and improve site efficiency.
Solcast is the world leader in real-time actuals and rapid-update solar forecasts. This solution utilises Solcast’s centralised Amazon Web Services’ (AWS) cloud infrastructure for all complex algorithmic processes and data plumbing. You will gain the power of AWS to interpret and deliver your data at top speed, providing real-time, historical and forecasting estimates direct to your API.
Receive monitoring and support from the Weatherzone and Solcast teams, 24/7. For more information, please contact us at apac.sales@dtn.com.




