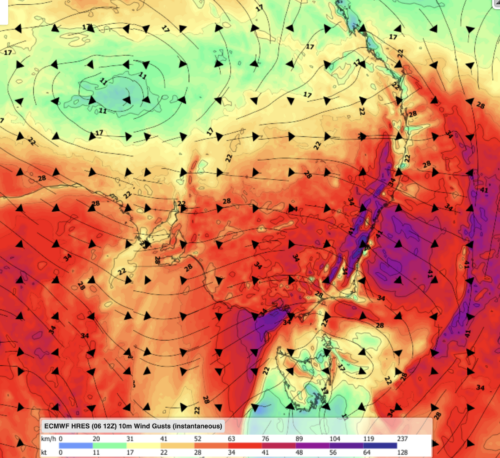
A thick cloudband will stretch thousands of kilometres next week from the warm tropical waters off northwest Australia to southeastern Australia, bringing rain and low solar output despite a sunny, dry seasonal outlook.
The cloudy week may come as a surprise given the warm, dry, and sunny climate drivers currently in play—a very strong El Niño and a developing positive Indian Ocean Dipole.
The animation below of 700hPa relative humidity tells the story clearly, tracking the tropical moisture in the mid layers of the atmosphere (shaded green) as it’s drawn southeast across the continent over the coming days by a strong cold front sweeping across the country.
Image: Relative Humidity 700hPa forecast over the coming week. Source: DTN
This tropical moisture will bring unseasonable rain and cloud to large parts of National Electricity Market (NEM) next week, reducing solar output for several days in some areas.
The Seasonal picture – solar friendly
El Niño is well underway in the Pacific Ocean, with two key measures scientists use to track El Niño breaking records in July 2026, with the event shaping up to be potentially one of the strongest events on record.
To the west of Australia, the Indian Ocean Dipole (IOD) has exceeded the positive threshold (+0.4°C) for three consecutive weeks leading up to August 08, 2026. This will need to be sustained for several more weeks before it is declared officially a positive IOD event.
The combination of the El Niño and potential positive IOD event typically brings warmer, dryer conditions to large parts of Australia, especially the southeast. Positive IOD events can also decrease the number of northwest cloudbands that impact Australia during winter and spring, translating to below average cloud cover and above average solar output.
NOAA’s daily 5km SST anomaly analysis (12 August) shows both the IOD West and IOD East monitoring boxes running warm, by roughly 1–2°C above average, with the IOD East box off Sumatra and Java showing some of the largest positive anomalies in the wider basin. The waters surrounding Australia, the Coral Sea, Tasman Sea, and much of the northwest shelf are similarly warm, leaving no shortage of moisture on hand to fuel cloudbands. This is a reminder that the IOD index is a difference between these two boxes, not an absolute reading; both regions can run warm while the west-minus-east gap still pushes the index positive.
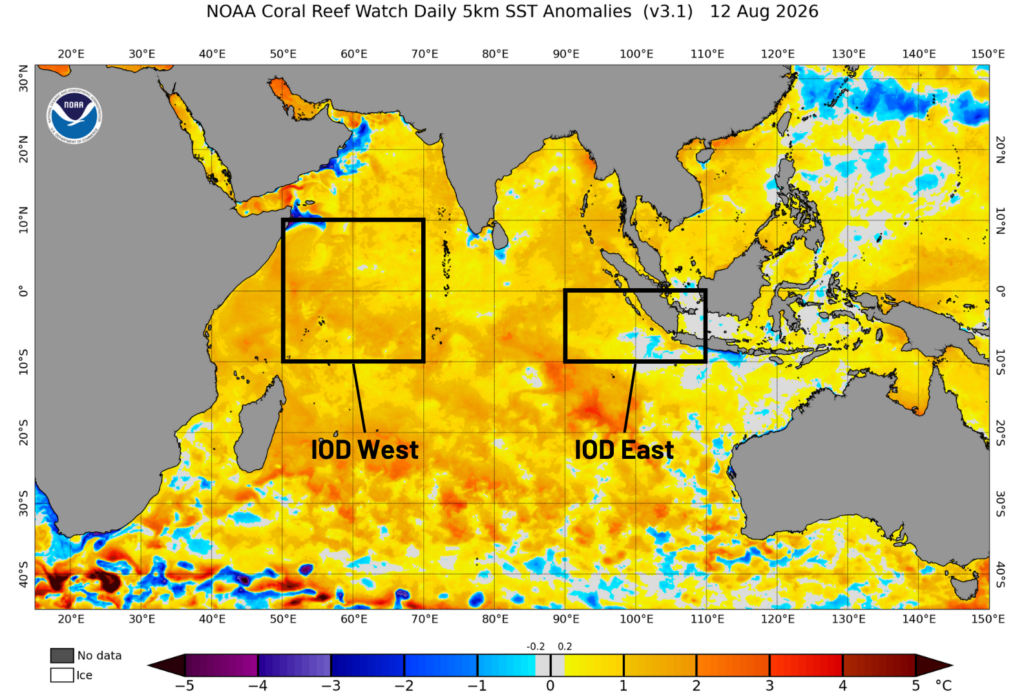
Image: Daily SST Anomaly chart for Wednesday, August 12. Source: NOAA Coral Reef Watch
At DTN APAC our seasonal outlooks have flagged this exact caveat: northwest cloudband may persist through spring and dent solar output in some areas, even though El Niño usually lifts it overall.
Next week’s northwest cloudband
The abnormally warm seas surrounding Australia are offsetting the influence of El Niño, feeding extra moisture into the atmosphere and setting up a northwest cloudband in the final weeks of winter.
The latest 7-day ECMWF HRES precipitation total, to Thursday 20 August, shows a continuous band of moisture stretching from the WA coast clean across the interior, with widespread totals of 20–40mm, and isolated falls of around 40-80mm through parts of SA, Vic, NSW, the ACT and Tas.
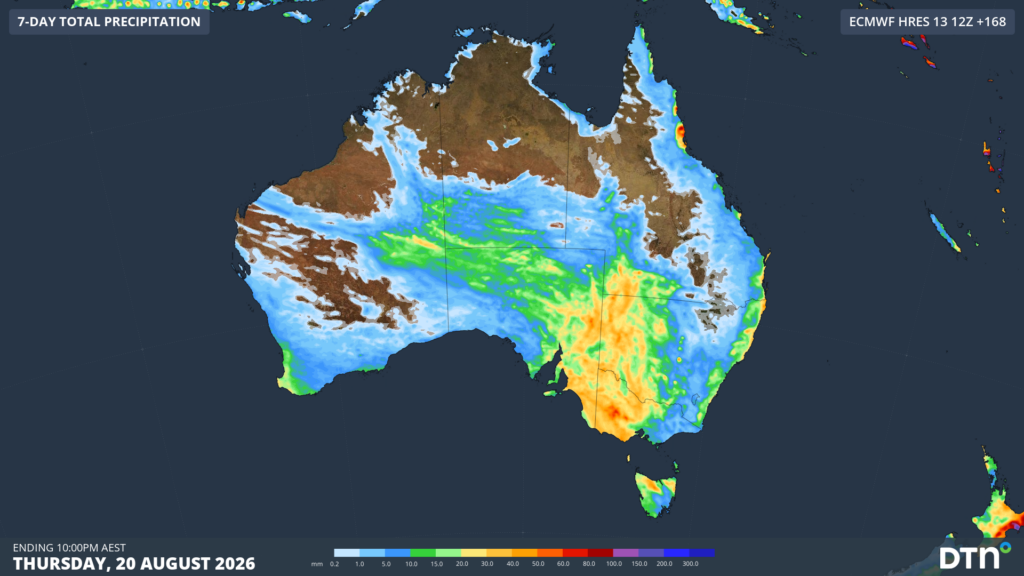
Image: ECMWF 7-day rainfall leading up to Thursday, August 20. Source: DTN
Driving it is a vigorous upper jet and trough across the south of the continent, tapping into that tropical moisture off the northwest coast and dragging it southeast, the textbook mechanism behind every northwest cloudband.
Storms and widespread rain are forecast through Thursday 20 and Friday 21 August, with totals of 30–50mm forecast across NSW, Victoria and Tasmania, and isolated falls of 60–80mm possible where storms are most persistent. As with any multi-day rain event this far out, there’s some spread between models on exact placement and totals.
This just goes to show that even with El Niño and a potential positive IOD pointing toward a drier, sunnier season, you can still get northwest cloudbands.
Cloudy week for the NEM
This is the useful nuance for clients and market participants: a favourable seasonal solar outlook is still made up of individual weeks.
- Generation impact: Widespread cloud cover across SA, VIC, and southern NSW during the cloud band’s passage will suppress solar output.
- Price impact: Reduced solar mid-day output typically firms up daytime wholesale prices and can shift the timing of the daily price trough, particularly if the band coincides with otherwise stable demand.
- Duration matters more than magnitude: A multi-day band like this has more market impact than a single overcast day.
El Niño and the potential positive IOD point toward an above-average solar output in the coming months but that’s a seasonal average, not a guarantee against individual disruptive weeks. This cloudband is a good reminder for anyone leaning on the seasonal outlook that sea surface temperatures are offsetting the dry climate drivers, and that near-term forecasts still matter for trading and generation planning, even inside a favourable season.
Thumbnail pictureCredit:Pixelci