Sea surface temperatures in the Indian Ocean suggest that a negative phase of the Indian Ocean Dipole (IOD) may be emerging, which could influence Australian weather patterns in the coming months.
What is the Indian Ocean Dipole?
The IOD is an index that measures the difference in sea surface temperatures across the tropical Indian Ocean. A negative IOD occurs when cooler-than-average water sits on the western side of the Indian Ocean, near the Horn of Africa, and warmer-than-average water lies on the eastern side of the Indian Ocean, near Indonesia. A positive IOD is the opposite of this pattern (cooler water in the east, warmer in the west).
Each phase of the IOD also influences atmospheric conditions above the Indian Ocean and surrounding countries. For Australia, a negative IOD typically increases the likelihood of above average rain over large areas of the country, while also promoting cooler days in the country’s south and east.
IOD events typically occur between May and November and break down when the monsoon arrives in late winter or early summer. While October is late in the year for an IOD event to become established, there is still time for a negative IOD this spring. The maps below show how a negative IOD would typically impact Australian weather between October and December.
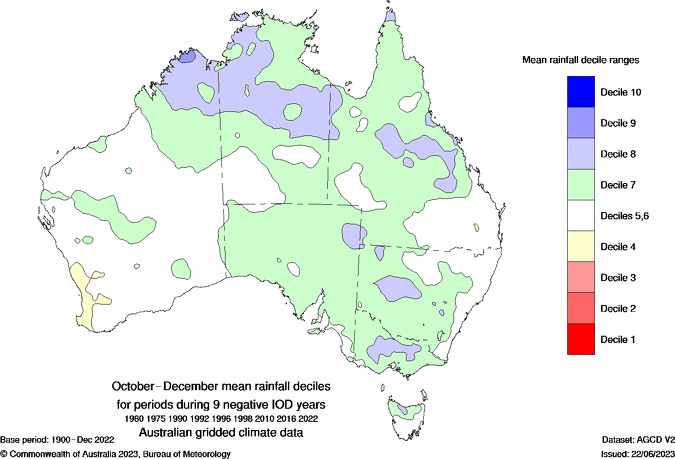
Image: Typical changes to rainfall when a negative IOD occurs between October and December. Source: Bureau of Meteorology
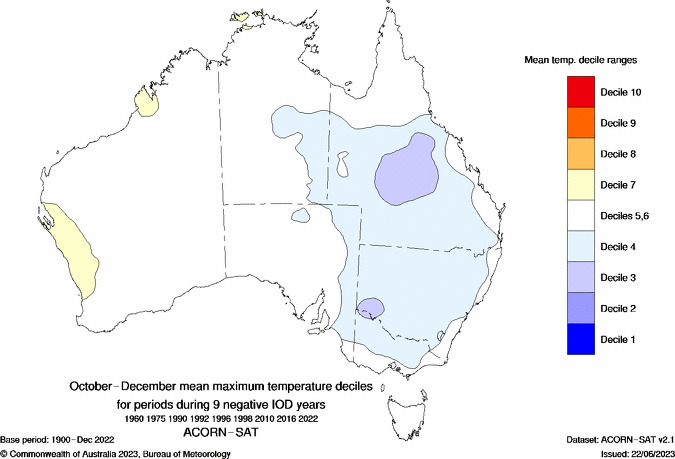
Image: Typical changes to maximum temperature when a negative IOD occurs between October and December. Source: Bureau of Meteorology
Negative IOD pattern emerging
The IOD is currently in a neutral phase, meaning neither a positive nor negative IOD is occurring. However, the map below shows sea surface temperature anomalies in the two IOD monitoring regions are beginning to reflect a negative IOD, with abnormally cool water in the west and warmer-than-average water in the east.
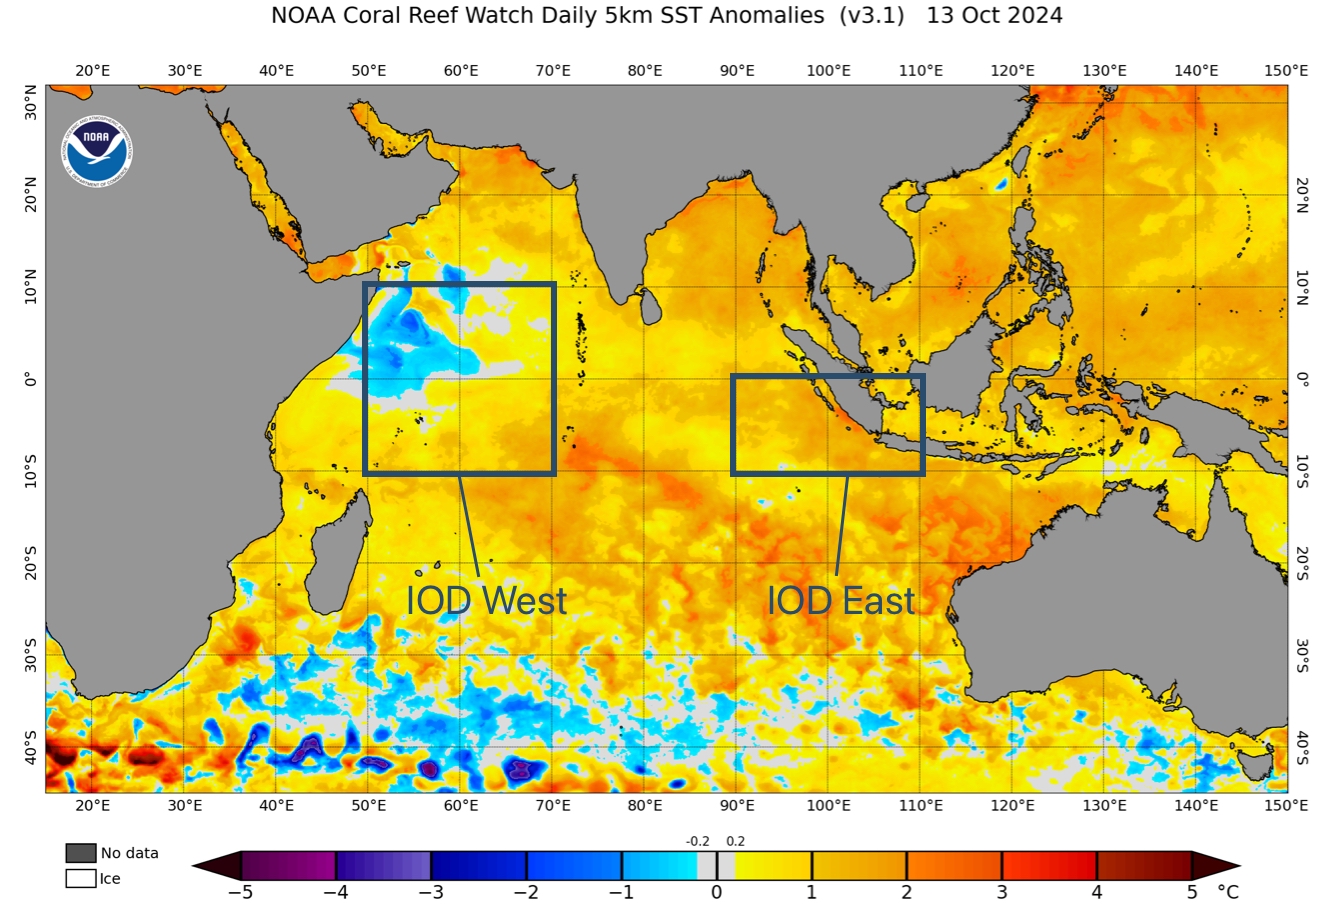
Image: Sea surface temperature anomalies in the IOD monitoring regions on October 13, 2024. Source: NOAA
In Australia, a negative IOD occurs when we see sustained IOD values below -0.4°C. The latest weekly IOD value was -0.58°C, which is the first reading below the -0.4°C threshold since 2022.
Most forecast models suggest that the IOD index will remain below -0.4°C through the second half of spring before returning to neutral values in December.
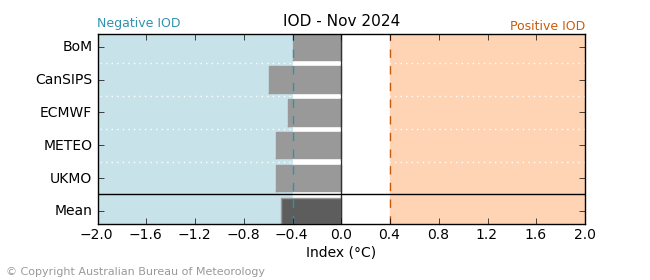
Image: IOD outlook for November 2024 from five international forecast models, all showing a weak negative IOD signal lingering through late spring. Source: Bureau of Meteorology.
While a negative IOD could develop, the most likely scenario is that the monsoon and MJO are influencing the eastern Indian Ocean waters. Whether its a developing IOD or not, the warm waters off the northwest shelf of Australia could increase rain and thunderstorm activity across parts of Australia in the coming months.
The maps below show predicted rainfall anomalies from the ECMWF-SEAS5 model for November 2024. The first map shows a signal of above average rain over the central and eastern Indian Ocean and below average in the western Indian Ocean. The second map highlights an increased likelihood for rain in northern and eastern Australia during November.
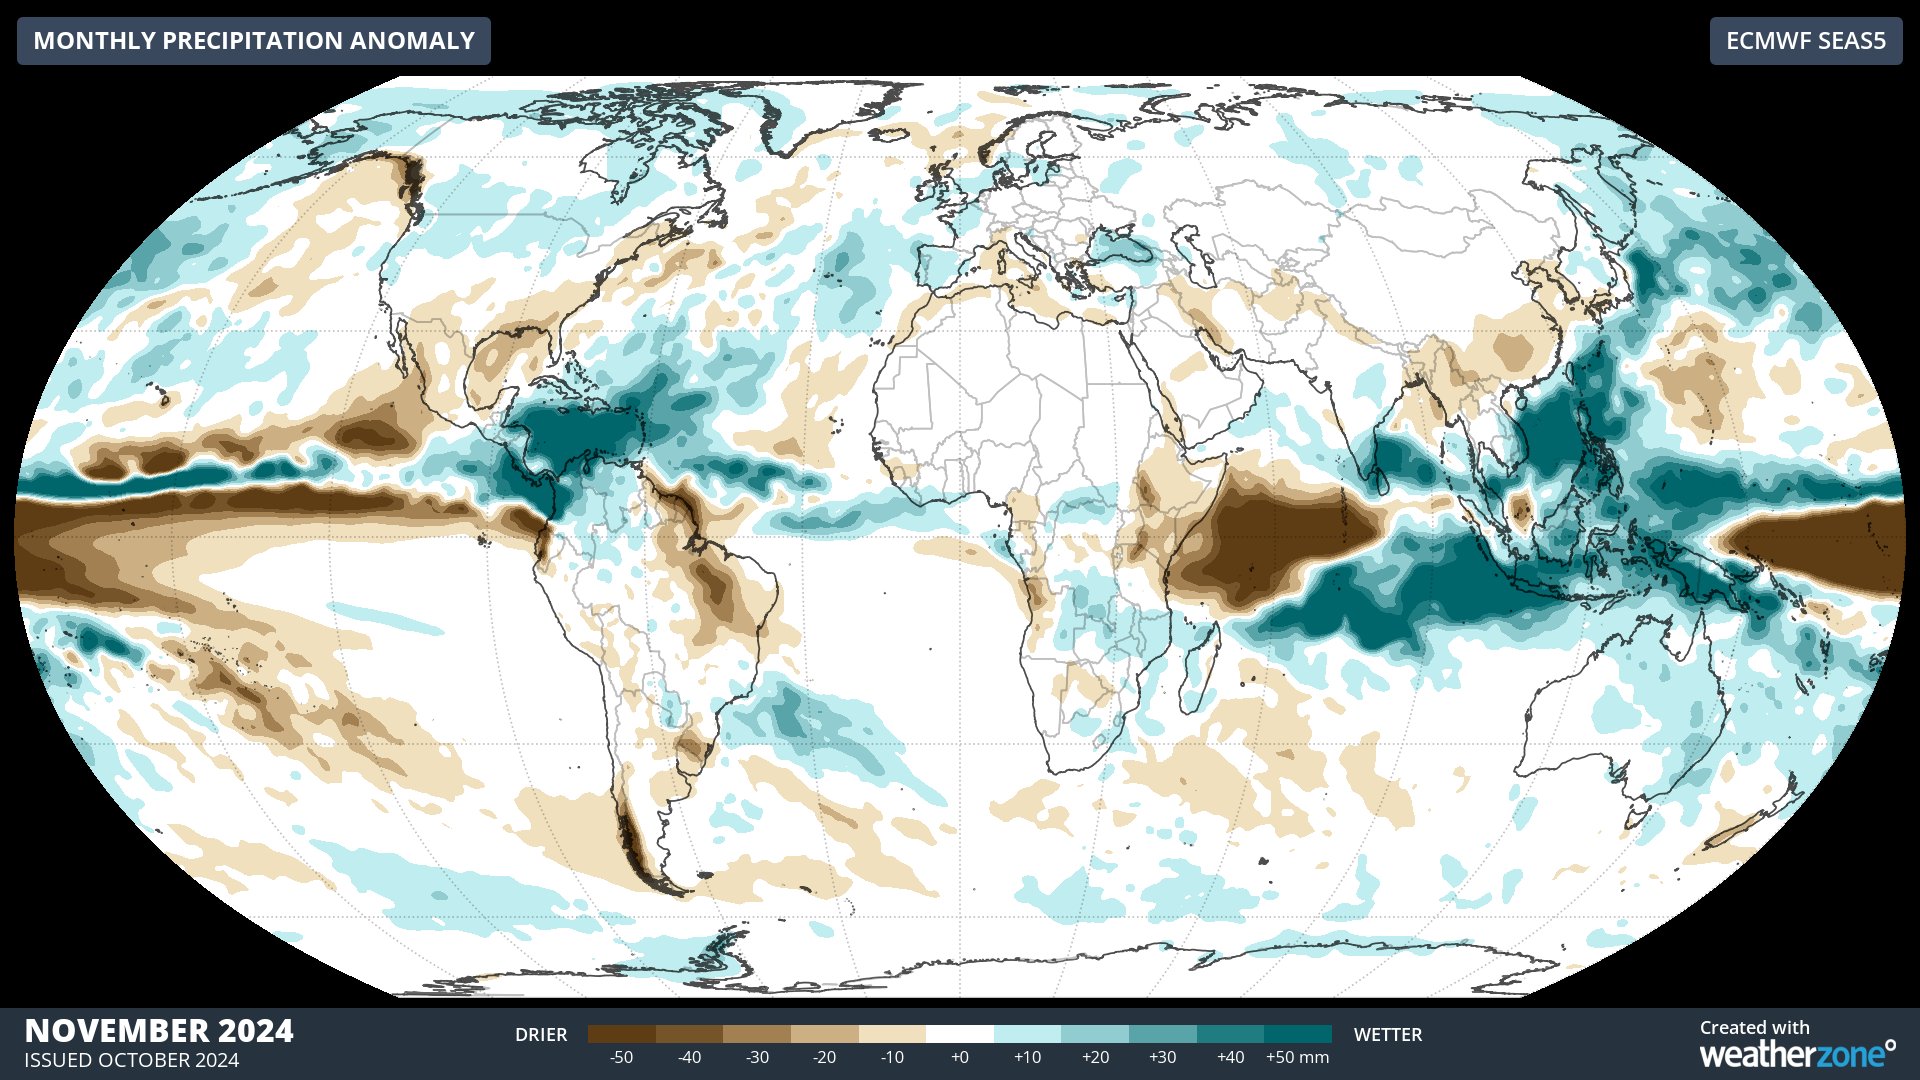
Image: Global rainfall anomaly forecast for November 2024.
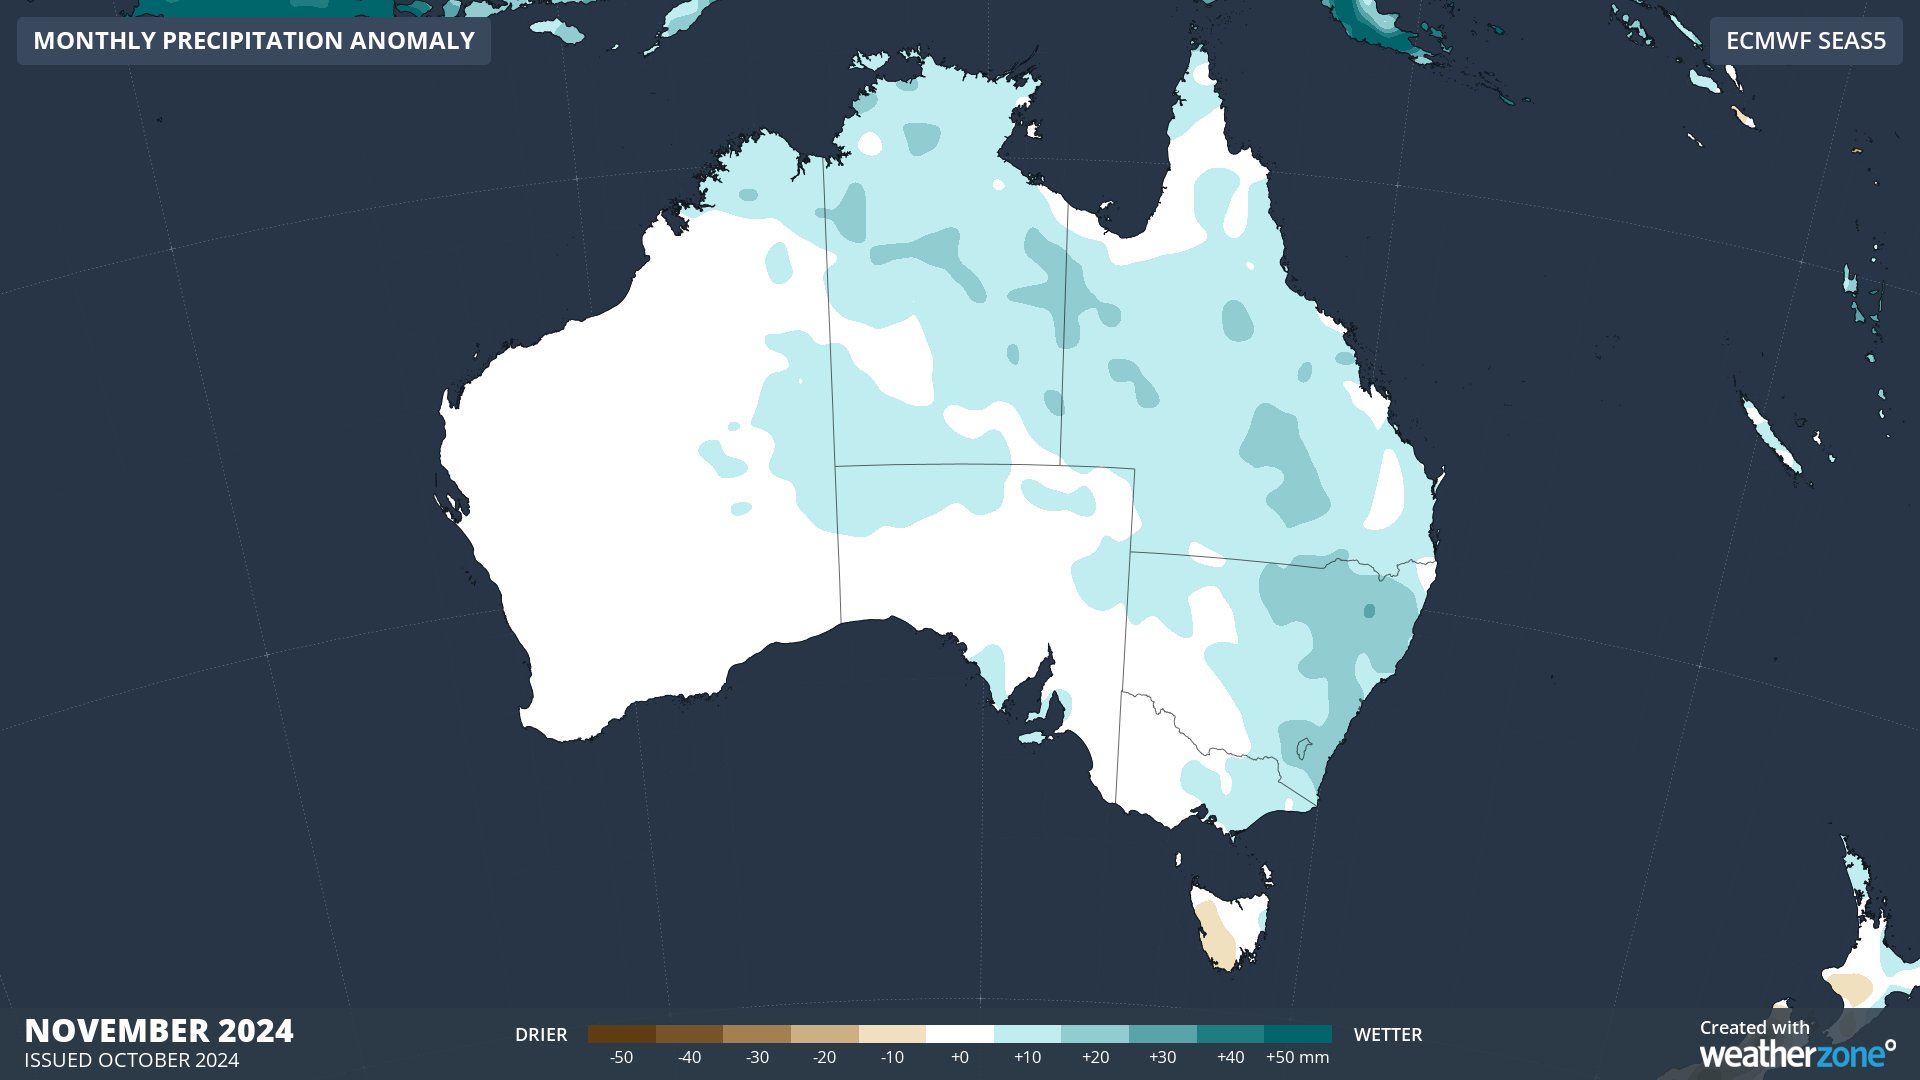
Image: Australian rainfall anomaly forecast for November 2024.
We provide detailed seasonal briefings specific to our clients needs with all of this information and more, to find out more please visit our website or email us at apac.sales@dtn.com.


