El Niño–favourable conditions are gathering pace across the tropical Pacific, with key ocean indicators approaching threshold levels and early atmospheric responses emerging.
While uncertainty remains around final El Niño strength, historical analogues show that even weak events can generate widespread impacts, including reduced rainfall, warmer daytime temperatures, increased frost risk, elevated fire danger, reduced tropical cyclone activity, and more. Industries including agriculture, energy, mining, transport, and insurance should stay informed as the climate pattern evolves.
The potential for El Niño development during winter has been highlighted in earlier outlooks over recent months, although conditions are now evolving a little faster than computer model guidance suggested. This transition is also not unusual, with El Niño conditions commonly developing following La Niña phases as the tropical Pacific shifts between opposite states.
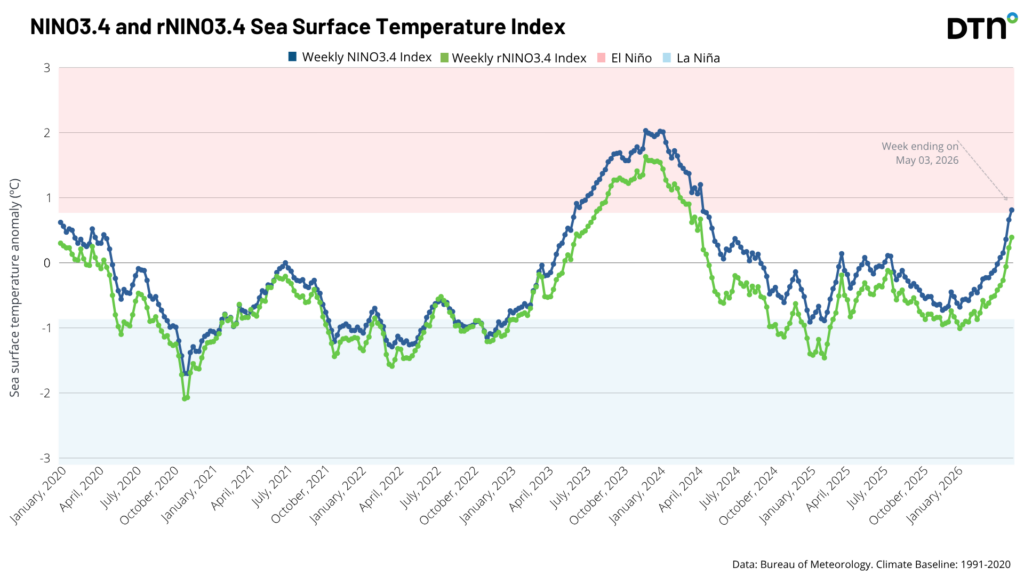
Ocean temperatures inside the key monitoring region for El Niño – an area known as the Niño3.4 region – has warmed rapidly this month, rising by 0.65°C from weakly negative anomalies into positive territory. This rapid transition from cooler than average to warmer than average oceans in the region is consistent with El Niño–favourable conditions.
Image: Daily sea surface temperature anomalies in the tropical Pacific Ocean during the last 30 days, with the Niño3.4 region highlighted. Source: NOAA, annotated by DTN
El Niño occurs when sea surface temperatures in the Niño3.4 region are warmer than average for several consecutive months. In Australia, the El Niño threshold is 0.8°C warmer than the long-term average.
For the week ending 3 May 2026, the standard Niño 3.4 index was +0.81°C above average, just above the El Niño threshold. The standard index is based on sea surface temperature anomalies compared to long-term climatology, which reflects broader background warming trends. The relative Niño 3.4 index, currently +0.39, is designed to better isolate ENSO-specific variability by comparing equatorial Pacific conditions against the broader tropical Pacific background state, reducing the influence of basin-wide warming linked to global warming.
Atmosphere responding
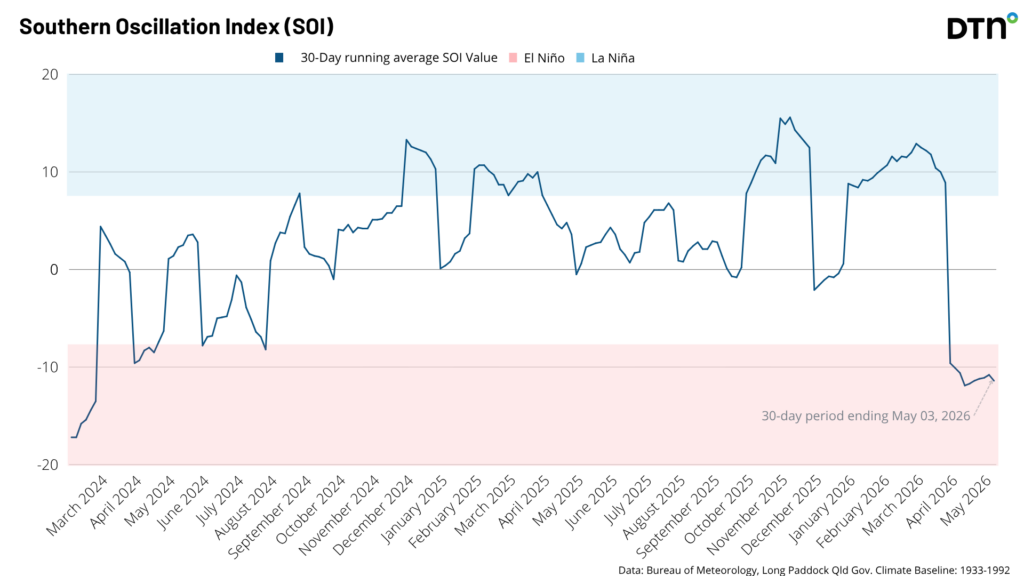
The atmosphere is beginning to show early signs of an El Niño pattern, with the 30-day Southern Oscillation Index (SOI) – a measure of atmospheric pressure differences across the tropical Pacific – dipping below -10 during late April. The latest weekly value was -11.4 for the week ending 3 May 2026, well below the El Niño threshold of -7. However, these negative values will need to be sustained over several weeks to confirm a more established atmospheric response consistent with El Niño conditions.
In addition, easterly trade winds across the western Pacific are showing signs of weakening, providing further early evidence of a shifting atmospheric circulation. While these changes are consistent with a developing El Niño pattern, full ocean–atmosphere coupling has not yet been established, and short-term variability remains a feature of the current phase.
Model forecast agreement
The Copernicus Climate Change Service (C3S) seasonal ensemble shows a strong signal for El Niño development through 2026, supported by multiple international modelling systems.
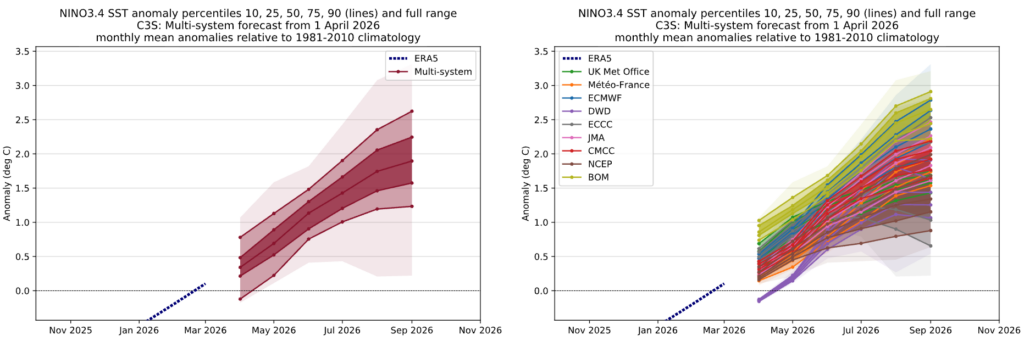
Image: C3S multi-system forecast for the Niño 3.4 SST anomaly percentiles from 1 April 2026.
The model plume highlights a strong signal for El Niño development through 2026, supported by both probability spread and multi-model agreement.
- Around 90–95% likelihood of El Niño conditions exceeding +0.8°C by mid-2026
- Approximately 75% probability of a strong El Niño (>+1.5°C) at peak
- Around 25% chance of a super El Niño (>+2.0°C) at peak intensity
- Most guidance indicates onset during May–June 2026, with peak conditions expected in September–October
- Strong inter-model agreement, with 7 of 8 systems (including ECMWF, UKMO, BOM and JMA) supporting El Niño development
Typical El Niño pattern across Australia
El Niño typically brings reduced winter rainfall and alpine snow depths, warmer daytime temperatures with increased heat extremes, and drier soils that increase fire danger across southeastern Australia. It is also associated with a higher risk of cooler nights and frost events, later monsoon onset, and reduced tropical cyclone activity.
El Niño impacts typically intensify through late winter and spring, reflected in the rainfall outlook below showing a strong signal for drier-than-average conditions across eastern and central Australia.
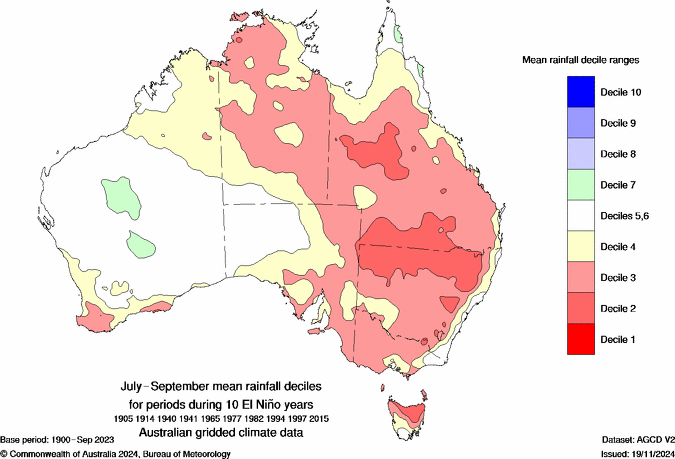
Image: Rainfall deciles between July to September during 10 El Niño years. Source: BOM
El Niño conditions are also often associated with a tendency towards more negative phases of the Southern Annular Mode (SAM), which shifts the belt of westerly winds further north across southern Australia.
This can increase the frequency and intensity of frontal systems affecting southern Australia, support stronger mid-latitude wind events, and create a more active winter storm season during winter. While eastern and northern Australia trend drier and warmer overall during negative SAM.
How could El Niño impact Australia’s industries?
Energy
In winter, El Niño conditions can support cooler nights, which can drive higher energy demand overnight and into the morning. At the same time, periods of negative SAM can enhance frontal activity across southern Australia, supporting stronger wind generation potential. By summer, above-average temperatures and increased heat extremes increase energy demand. The extreme heat can also place additional stress on transmission networks, reducing line efficiency.
Mining
During the northern Australia dry season, elevated fire risk and dry conditions can affect access routes, site operations, and logistics across remote regions. Through, the wet season risks shift toward delayed or weaker monsoon onset, reduced tropical cyclone activity, and heat-related operational stress.
Transport and logistics
Winter impacts are typically driven by more variable frontal systems, temperature swings, and operational disruptions linked to rapidly changing weather conditions. By summer, the focus shifts toward heat-related operational constraints, reduced efficiency in freight and aviation networks, and increased dust and visibility issues in inland regions under drier conditions.
Insurance
During winter, El Niño combined with negative SAM can increase the frequency of frontal systems across southern Australia, raising the likelihood of damaging wind events and storm-related insurance losses. At the same time, drier conditions in northern Australia can elevate fire weather risk earlier in the season. These risks typically evolve into heat and bushfire exposure through spring and summer.
Agriculture
Impacts often begin to emerge during winter, with increasing rainfall variability and early declines in soil moisture setting the baseline for the season ahead. Through this period, pasture growth typically slows and water availability becomes more variable, particularly across eastern and northern Australia. By summer, impacts generally intensify, with reduced rainfall reliability, higher irrigation demand, increased feed costs, and greater yield variability across key cropping regions.
Past major El Niño events
Three major El Niño events-1982–83, 1997–98 and 2015–16 provide useful benchmarks for understanding how strong ENSO phases translate into Australian climate and business impacts.
1982-83
One of the most significant El Niño events on record, characterised by severe drought across key agricultural regions, extended heat periods, devastating bushfires in south-eastern Australia, including Ash Wednesday on 16 February 1983.
1997-98
A very strong El Niño event that delivered widespread rainfall deficits across eastern Australia, above-average temperatures across large parts of the continent, significant agricultural impacts, increased bushfire risk and extended fire seasons.
2015-16
A slightly lower-intensity event compared to the events above, but associated with widespread heat and rainfall deficits, significant agricultural stress across grazing and cropping systems and elevated fire weather conditions across multiple states.
While El Niño events generally follow similar patterns, no two events are the same. Each is influenced by warming ocean conditions and longer-term cycles such as the Pacific Decadal Oscillation (PDO), which can modulate how impacts unfold, particularly through late spring and summer. Shorter-term drivers including the Southern Annular Mode (SAM), Indian Ocean Dipole (IOD), and Madden–Julian Oscillation (MJO) also play an important role in shaping how El Niño affects Australia over the coming seasons.
How can DTN APAC help?
As El Niño conditions evolve, the challenge is not just understanding the climate signal but translating it into operational decisions.
DTN APAC provides layered weather intelligence connecting large-scale climate drivers like El Niño to real-world business impacts, including:
- Seasonal rainfall and temperature outlooks
- Sub-seasonal forecasts (2–6 weeks) for emerging high-impact weather windows
- Monitoring of heat, fire weather, storms, drought, and other climate risks
- Industry-specific forecasting solutions across weather-sensitive sectors
- Earlier risk awareness and improved planning through seasonal transitions
Together, these tools help businesses build resilience and make more informed decisions as conditions evolve through winter, spring, and summer.
Get in touch with our team of experts today at sales.apac@dtn.com