A vast area of northern and eastern Australia is set to see persistent rainfall and thunderstorm activity in coming days, with the potential for flooding in many areas.
If you want to understand why, the image at the top of this story explains all.
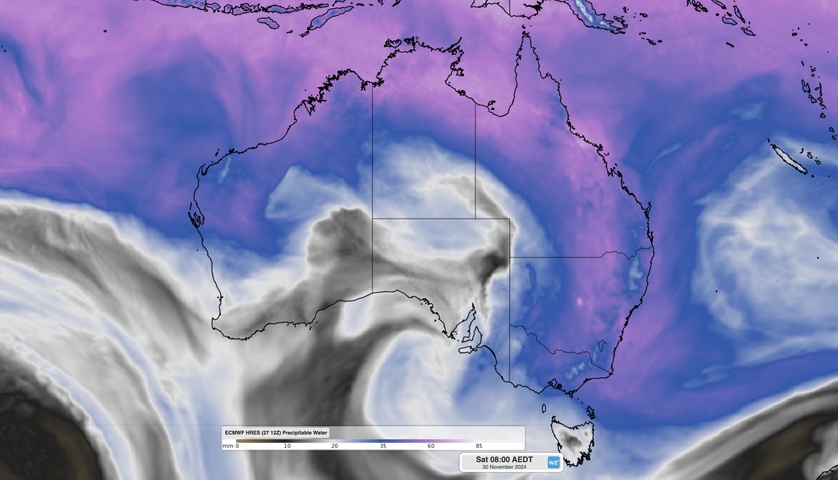
The image shows the amount of “precipitable water” in the atmosphere, which in simple terms means the amount of moisture in the atmosphere that can be converted into rain.
Image: Pink areas mean higher amounts of moisture in the atmosphere.
As you can see, tropical moisture is being transported from the Indian Ocean off northwest Australia all the way down to eastern NSW and Victoria. It should even reach Tasmania later this weekend.
The effects of this vast airborne atmospheric river?
As mentioned, rain and storms, and plenty of both. The image below shows the expected rainfall accumulations over the next seven days (according to one model).
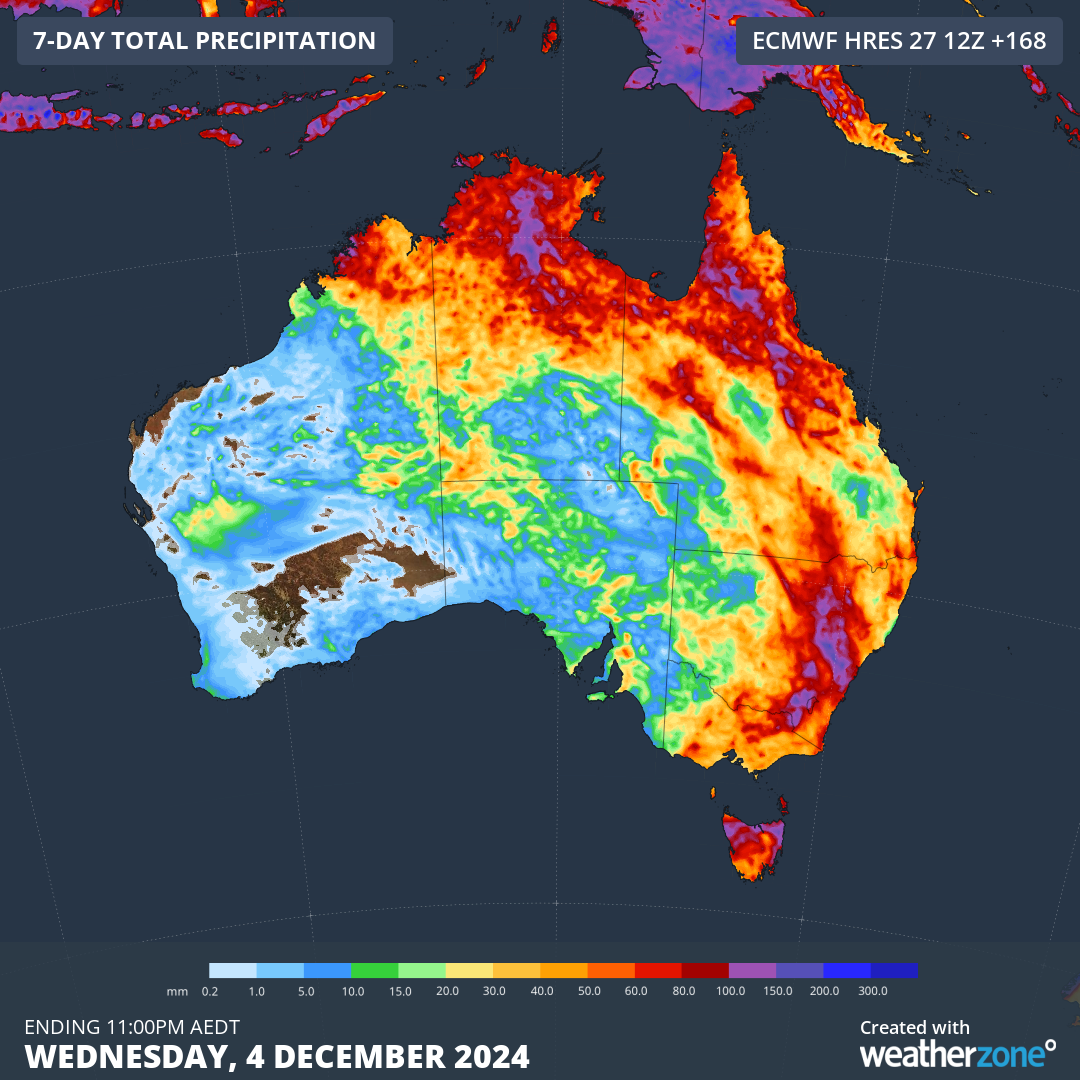
Image: Areas of purple mean 100mm or more of accumulated rainfall. Source: ECMWF.
As you can see, heavy rainfall can be expected across most of tropical Australia, and right across eastern Australia. Only South Australia and subtropical Western Australia look set to miss out on the heavy stuff.
The other key part of the equation behind the current high rainfall potential across eastern Australia is the broad low pressure trough over the region.
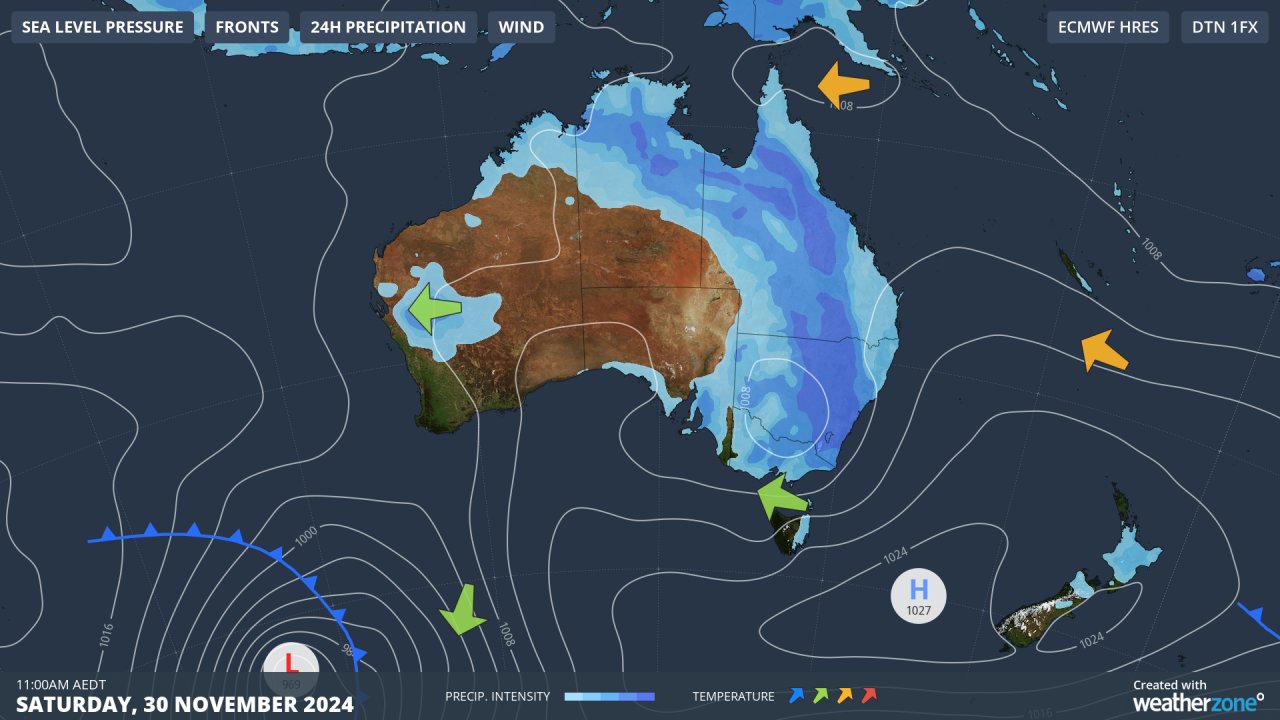
Image: Synoptic chart for Saturday, November 30.
As illustrated on the synoptic chart above, a broad trough of low pressure extends from the Top End to Victoria. And systems are currently relatively slow-moving, so the current pattern won’t change too much over the next few days.
With plenty of warm air still lingering in eastern Australia (even after the hottest air dissipated after western Sydney reached 39.9°C on Wednesday), all the ingredients are in place for a widespread multi-day outbreak of rainfall and thunderstorms.
Stormtracker is a severe weather solution that can assist you in observing, in real-time, any storm or event that has the potential to impact your business.
Embedded in DTN’s industry interfaces, the system gives you a time advantage when monitoring conditions developing over your infrastructure and location.
Stormtracker is our Global Information System (GIS) tracking tool, providing multiple weather layers and zoom controls overlaid on a map of your location and infrastructure. You can choose a snapshot or full screen view, depending on your requirements. The maps allow you to monitor all weather, and specifically any systems likely to cause risk for your business. You also have the capacity to observe:
- real time lightning and thunderstorm alerts
- localised lightning strike frequency
- official warnings for storm, cyclone, wind, flood and fire
- sentinel hotspot fires and fire agency current incidents
Stormtracker’s radar imagery updates every 10 minutes, so you are always able to respond rapidly to changing conditions. You can customise alerting to notify you when your staff or infrastructure are under threat. With increased situational awareness, your ability to make informed decisions quickly is optimised.
DTN’s experience and intelligence gives you a clear path through complex situations. Let us assist you, offering actionable insight when extreme weather poses risk to your business. For more information please visit our website or email us at sales.apac@dtn.com.
Title image credit: iStock / sjallenphotograpy


