
Australia just had its warmest winter on record across large parts of the country, and the mild weather produced the lowest gas output since 2004 and cut wholesale electricity prices nearly in half. Despite the unusually warm winter, demand hit a new NEM-wide winter record of 24,220 MW — but ample rooftop and grid solar meant the grid itself had to supply almost no energy on some days, pushing demand troughs to record lows in Victoria and South Australia.
The renewables share of the electricity market also hit a record high this winter, although it has been climbing almost every winter for a decade as new solar and wind farms come online.
Mild winter 2026
Nationally, average temperatures ran 1.45°C above the 1961–1990 benchmark, the third-highest anomaly on record. The warmth was widespread, with almost the entire continent at least 1°C above average, but the map below shows one standout hotspot: a broad band across central Queensland and the Gulf country running around 2°C above average, well ahead of the rest of the country.
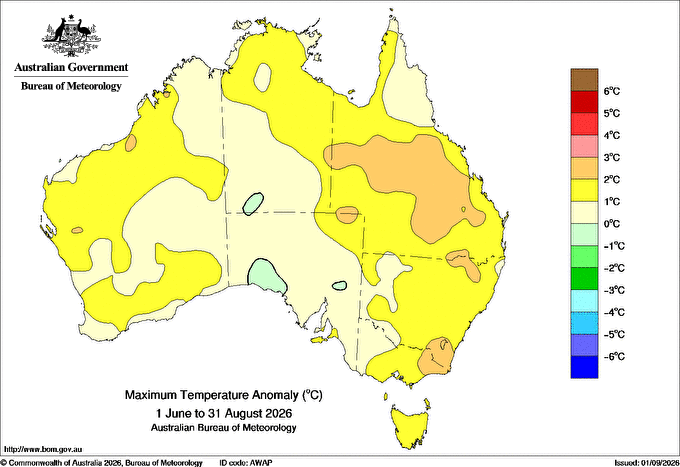
Image: Maximum temperature anomalies, June–August 2026, relative to the long-term average. Source: Bureau of Meteorology.
Some other stand-out statistics from this winter were:
- New South Wales, Victoria and Tasmania each had their warmest winter since 1910.
- Western Australia had its warmest winter on record at the state level.
- Melbourne recorded its warmest winter since records began in the 1850s.
- Snow cover hit a historic low, with Three-Mile Dam in Victoria holding just 5.5cm.
The drivers behind the warm winter
Winter 2026 was driven mainly by a strong El Niño combined with a mostly positive Southern Annular Mode (SAM), which kept the belt of westerly winds and the cold fronts further south toward Antarctica for most of the season. This produced widespread warmth and the sluggish start to the snow season. However, there was one notable exception: in mid-to-late July, the SAM briefly flipped negative, allowing stronger cold fronts and storm systems to reach southern Australia and Tasmania, bringing a burst of rain and snow before the pattern shifted back later in the season.
Mild winter didn’t flatten the demand peaks
Typically, with a warmer winter, less heating is needed, lowering electricity demand.
However, according to AEMO underlying demand across the National Electricity Market hit a new winter-quarter record of 24,220 megawatts, edging past the previous high set in 2025. Population growth, electrification of homes and vehicles, and the growing footprint of data centres kept pushing raw demand upward even as the weather worked to suppress it.
The mild weather did flatten the energy peaks. Maximum operational demand, the moment the grid had to work hardest was 30,697 MW, nearly 2,000 MW (6.1%) below the previous winter’s peak, with every region recording a lower maximum.
At the other end of the scale, Victoria and South Australia both set new record lows for minimum demand: Victoria’s trough fell to 1,986 MW, down 11% year-on-year, while South Australia’s collapsed to just 57 MW, down a striking 64%. Both records were set on mild, sunny days when rooftop solar was doing most of the work as mentioned above.
The graph below shows how peak energy periods flattened despite the record demand, with maximum operational demand, Victoria’s minimum demand, and wholesale prices all lower in Q2 2026 than Q2 2025.
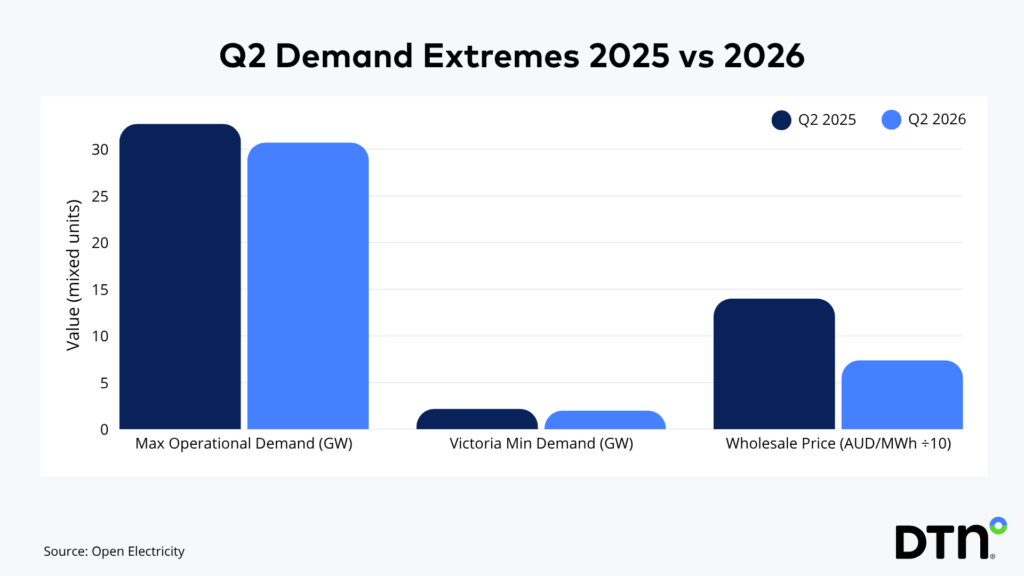
Image: Q2 2025 vs 2026 demand extremes -maximum operational demand, Victoria’s minimum demand, and wholesale price. Source: Open Electricity and AEMO
Gas had its quietest winter in 22 years
Gas output collapsed this winter. AEMO recorded an average generation rate of just 1,050 MW across the quarter -down 30% on last year. While the graph below shows that the total energy gas produced over the season came to 2,602 gigawatt hours, the lowest winter total in 22 years.
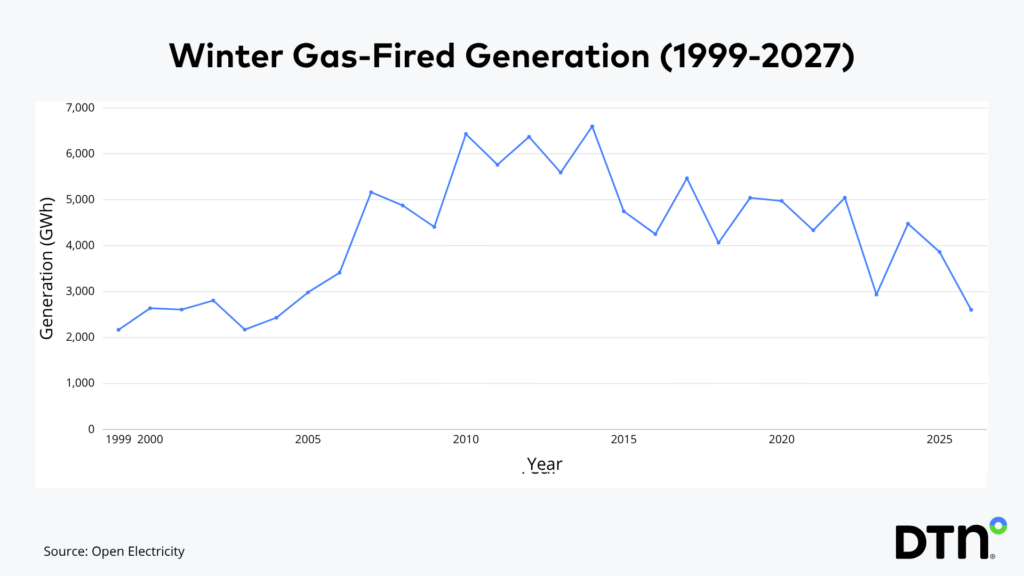
Image: Winter gas generation, 1999–2026 (line). Source: Open Electricity and AEMO
Wind and solar capacity didn’t grow anywhere near enough to explain a drop that size; gas mainly exists to cover demand peaks, and this winter’s peaks were simply unusually small.
Renewables hit a record contribution – a continuing trend
The renewables’ share of NEM generation hit a new winter high of 42.1%, up from 37.1% the year before. However, winter-on-winter increases of 3.5–4 percentage points have been normal for years, with similar jumps as new farms come online.
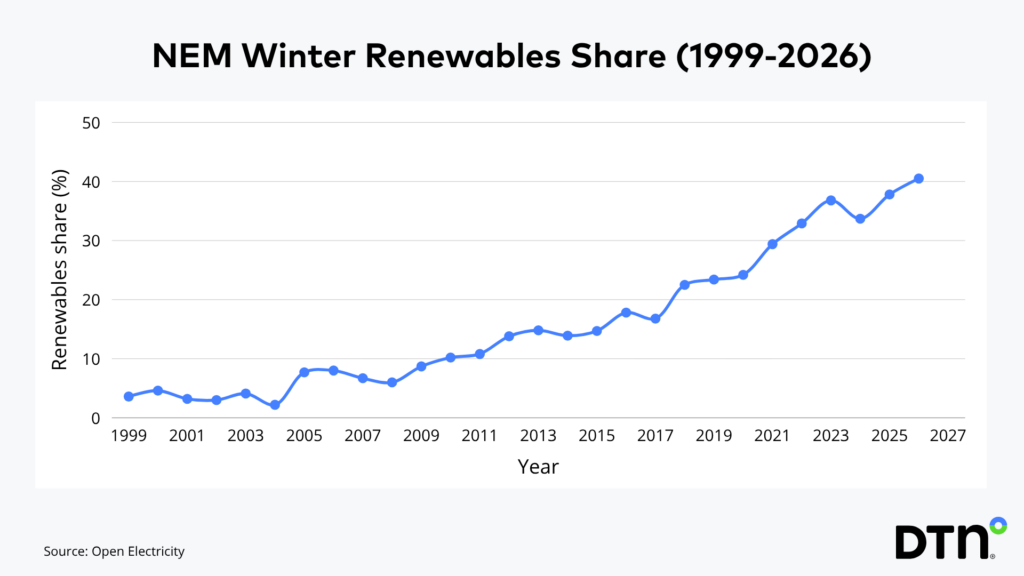
Image: Renewables share, 1999–2026 (line). Source: Open Electricity and AEMO
Prices crashed with mild winter
NEM-wide wholesale electricity prices averaged $74 per megawatt hour for the winter quarter, down 47% year-on-year, which is too large a drop to attribute to steady renewables growth alone.
Prices are set at the margin, and a flatter demand curve meant the expensive marginal generator (usually gas) got called on far less often. Victoria recorded the cheapest power in the country at $56/MWh, down 60% on the year before; New South Wales saw the single largest year-on-year drop of any region, at 53%.
The contrast with recent history makes the scale of the drop clear, Winter 2022, averaged $308/MWh and four years later, the same season averaged less than a quarter of that.
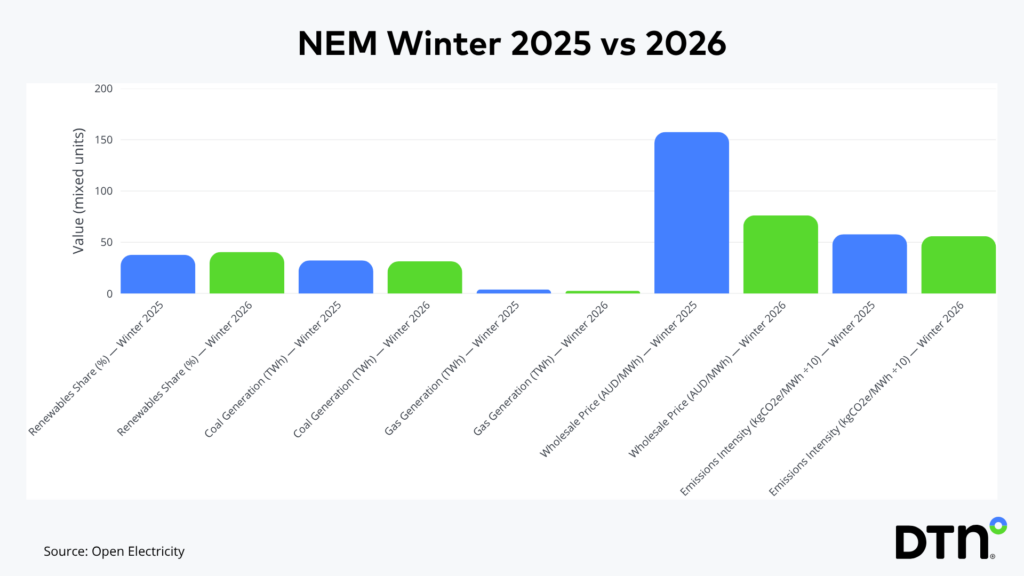
Image: Winter 2025 vs 2026 snapshot (renewables share, coal, gas, price, emissions intensity). Source: Open Electricity and AEMO
Overall, the renewables hitting a record share isn’t a weather story, it was the fact that more wind and solar farms come online each year. The impact of the warm winter did however remove the usual demand spikes that force gas plants to switch on. With smaller peaks and record-low troughs in Victoria and South Australia, gas simply wasn’t needed as much, pushing it to a 22-year low and dragging prices down 47%.
Learn how DTN APAC supports the Energy sector today, including:
- Renewables (incl. Solar, Wind, and Hydro);
- Energy Trading and Risk; and
- Energy Power Networks and Utilities.




