
October 2024 was Australia’s second-warmest October since comprehensive nationwide records were first kept in 1910.
Temperatures across the country were 2.51°C above average in terms of what the BoM calls the “national area-averaged mean temperature” – a term which simply means the average of daily maximums and minimums at hundreds of different weather stations across the country.
In a strong signal of the underlying influence of the warming climate, this was the ninth month (of ten) to date in 2024 which saw nationwide temps well above average. Only April has bucked the 2024 trend with nationwide temps that were slightly cooler than average.
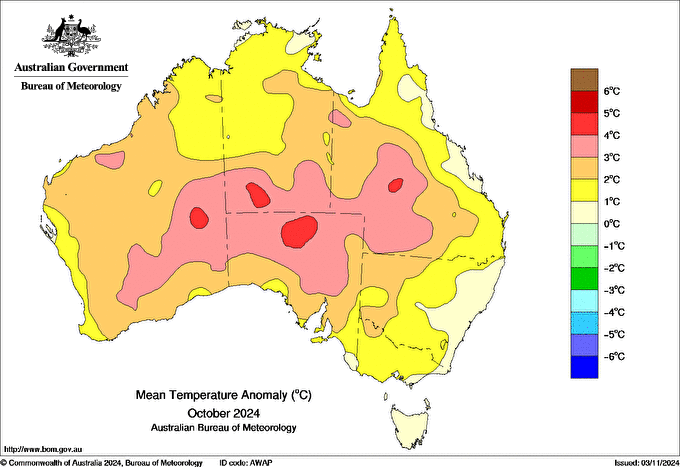
Image: As the chart above shows, no part of Australia saw below-average temps in October, while the biggest anomalies were towards the centre of the country. Source: BoM.
The list below shows the national temperature anomalies (difference from the long-term average) for all months to date in Australia for 2024:
- January +1.54°C
- February +1.71°C
- March +1.11°C
- April –0.51°C
- May +0.99°C
- June +0.71°C
- July +0.70°C
- August +3.03°C
- September +1.89°C
- October +2.51°C
Meanwhile, Queensland led the way for heat anomalies in October 2024, recording its hottest October on record, with an area-averaged mean temperature that was 2.77°C above the long-term average.
South Australia led the way with the biggest anomaly of 3.61°C above the long-term average, although this was not the warmest October on record (it was the fourth-warmest).
It’s also worth noting that all states were at least two degrees above average in terms of their statewide averaged maximums, with the exception of Tasmania where max temps were 0.99°C above the long-term average.
In terms of rainfall, it was relatively dry in the most populated corner of the country, with rainfall falling slightly below average in Sydney and Melbourne, and well below average in Canberra, Adelaide and Hobart.
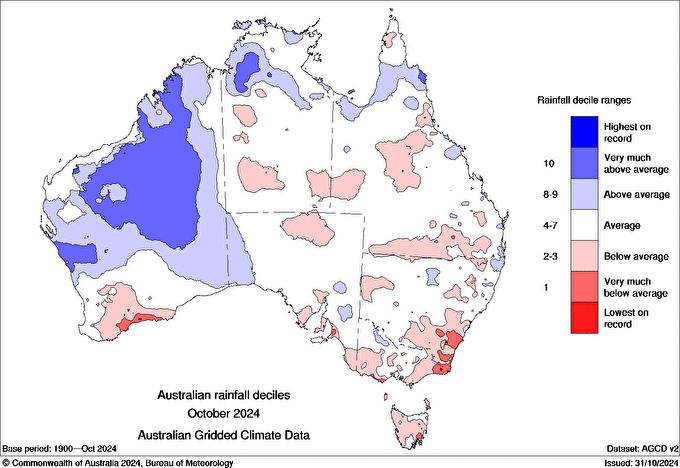
Image: As the chart shows, areas near the southeastern capital cities all experienced drier than usual conditions in October 2024. Source: BoM.
Australia-wide, rainfall was 18.4% below the long-term average in October, with the dry pattern in the southeast offset by significantly wetter-than-average conditions elsewhere, especially in large parts of Western Australia.

Image: Australia’s second-warmest October was no laughing matter. Source: iStockphoto/tracielouise.
Benefit from our detailed seasonal forecasts, allowing informed and effective decision-making. For more information please visit our website or email us at .


