
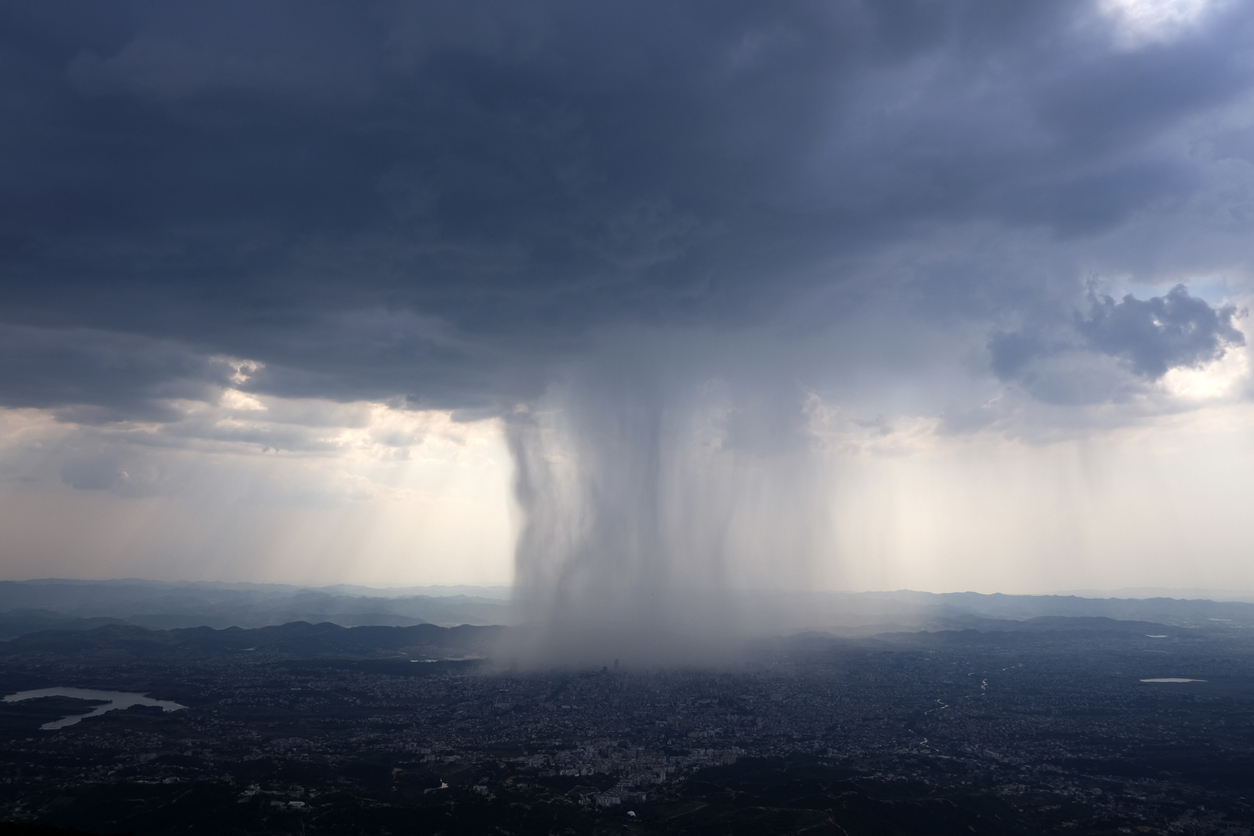
Record breaking rainfall, catastrophic floods and severe thunderstorms have impacted parts of eastern Australia during the last couple of months, despite El Niño underway in the Pacific Ocean. So, what is behind this wet weather?
El Niño is a well-known global climate driver that promotes below average rain and above average daytime temperatures in Australia, particularly in winter and spring. However, it is important to note that no two El Niño events are the same, with other climate drivers playing a significant role in Australia’s weather too.
El Niño’s influence on Australia’s climate was clear in late winter and early spring 2023, with August to October ranking as Australia’s driest three-month period since records began in 1900. This remarkable dry period was then followed by widespread rain and thunderstorms across eastern and southeastern Australia in November and December 2023, and early January 2024.
The dry weather during early to mid-spring was influenced strongly by El Niño and a positive phase of the Indian Ocean Dipole (IOD).
The map below shows the observed rainfall deciles for September to October 2023, showing the impact these climate drivers have in spring.
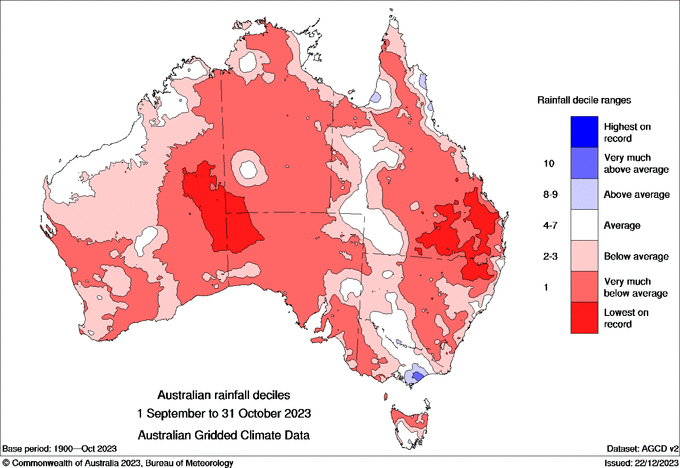
Image: Rainfall deciles for September-October 2023. Source: Bureau of Meteorology
Following this exceptionally dry two-month period, thunderstorms and rain affected large areas of Australia in November, December and early January, with above average rainfall recorded across parts of SA, Vic, NSW and Qld.
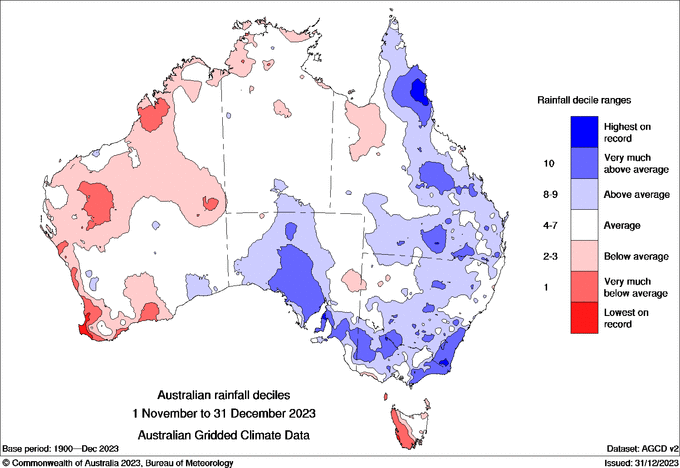
Image: Rainfall deciles for the November-December 2023 period. Source: Bureau of Meteorology
This return of wet weather was caused by a positive phase of the Southern Annular Mode (SAM) and the waning influence of El Niño.
The map below shows the summer rainfall deciles during 14 El Niño years, showing that during El Niño years much of the country can expect average to above average rainfall. Note just how much of the country is close to average during the summer months, with some parts even seeing a wetter than normal tendency.
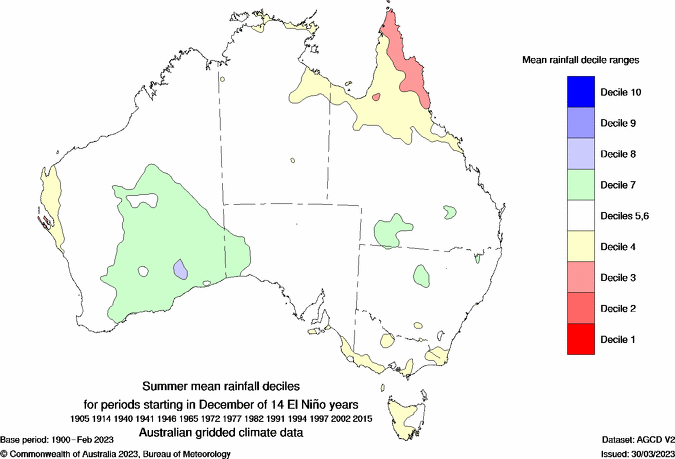
Image: Summer mean rainfall deciles for 14 El Niño years, source: BOM
The graph below shows that we have been in a positive phase of SAM since late last year and is expected to remain so for the next few weeks.
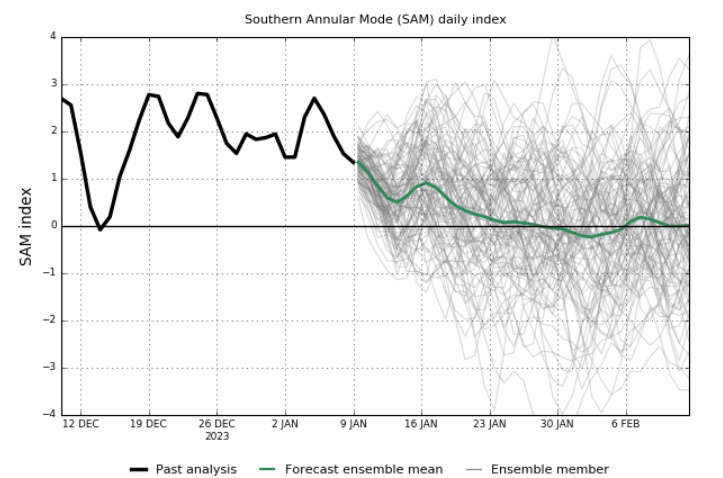
Image: The Southern Annular Mode observation (black solid line) and forecast (green), source: BOM.
The Southern Annular Mode (SAM) refers to the north or south shift of the westerly frontal belt that flows between Australia and Antarctica and affects parts of southern Australia.
A positive SAM during summer will usually:
- Enhance the onshore flow of winds over eastern Australia
- Increase rainfall over eastern and southeastern Australia
- Decrease the likelihood of extreme heat in eastern and southeastern Australia
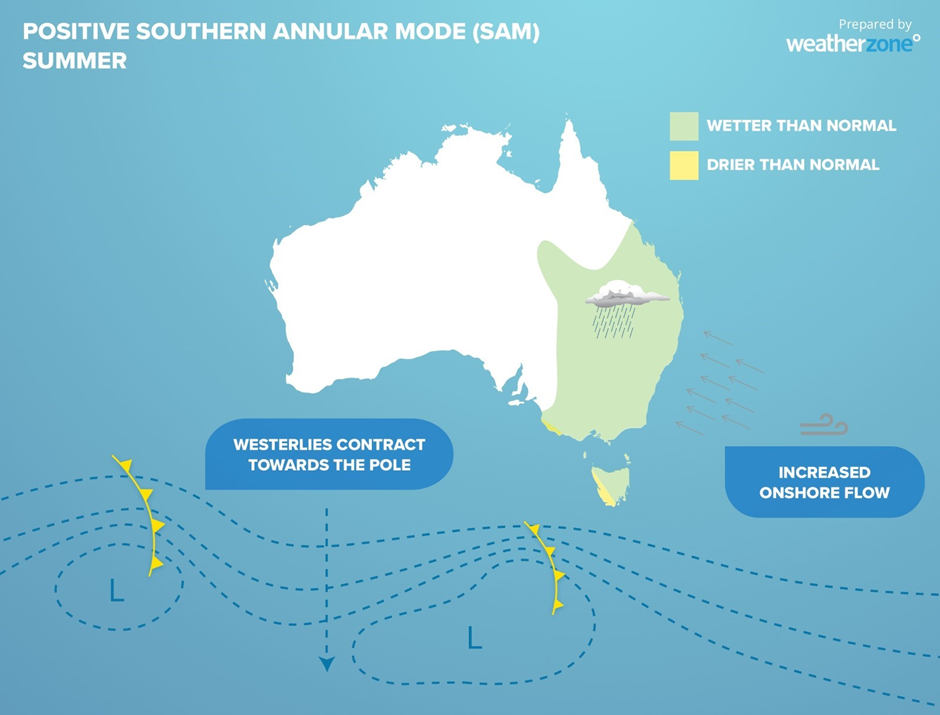
The prevailing onshore winds during the past few months have dragged moisture-laden air into eastern Australia off the unusually warm Tasman Sea.
The map shows that the waters near Vic and southern NSW were 1 to 1.5°C above average near NSW and Vic on Tuesday.
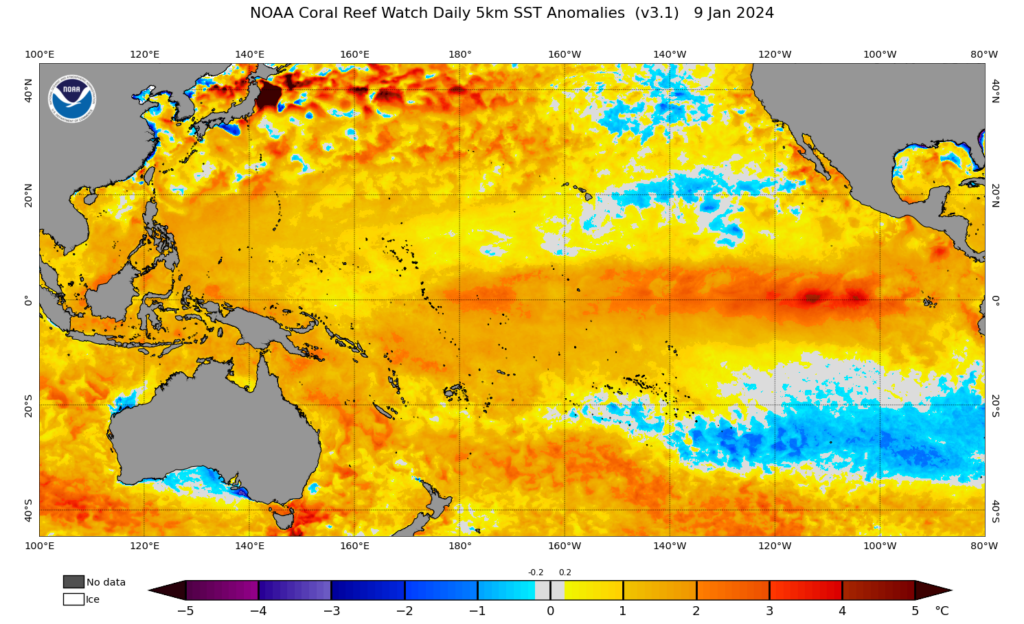
Image: Sea surface temperature anomaly for Tuesday, January 9, source: BOM
The moisture provided by these warm oceans have been transported into eastern Australia, fueling the heavy rainfall events we have seen in the past couple of months.
While El Niño is still in place, the positive SAM and abnormally warm water in the Coral and Tasman Seas has fuelled rainfall and storms this summer. From 14 day forecasting to seasonal outlooks, you have access to complete and powerful weather intelligence giving you the confidence to make the best call. For more information, please contact us at apac.sales@dtn.com.




