
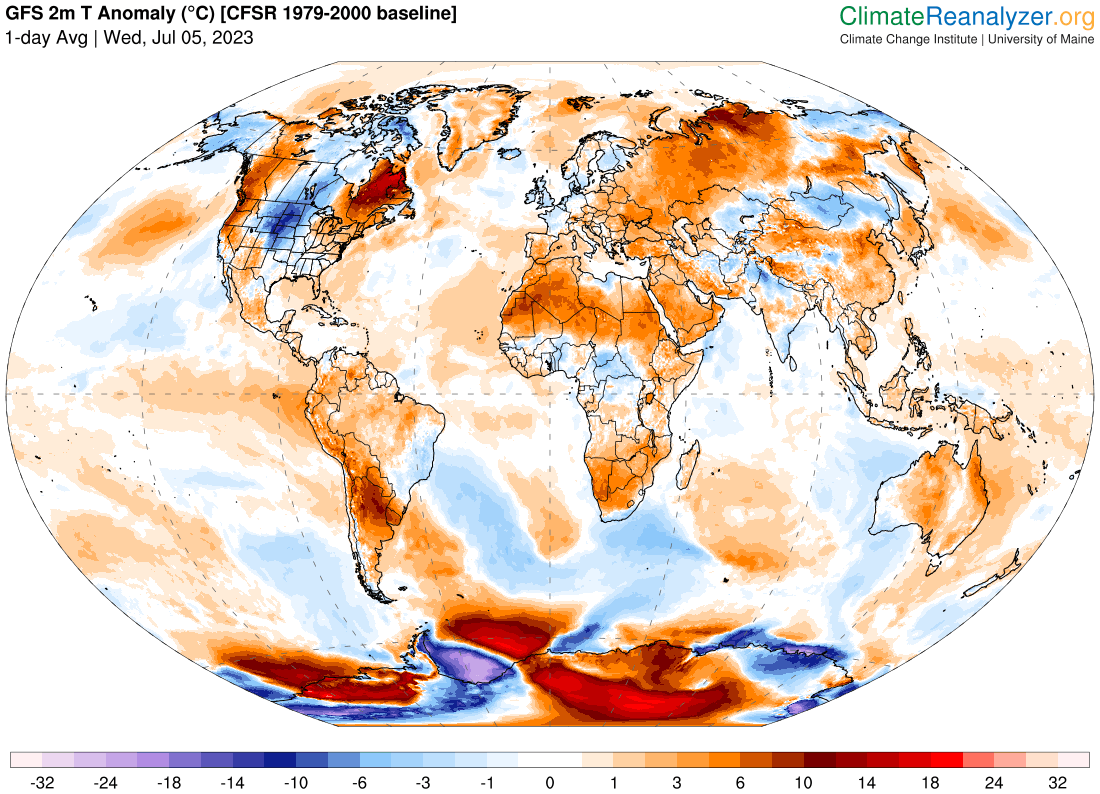
The record for the world’s hottest day has been broken twice this week, according to new data published by the University of Maine’s Climate Change Institute.
We are talking here about global average temperatures, NOT the hottest single official reading, which for the record was 56.7°C at Death Valley in the western USA in 1913.
So how warm was the global average this week?
- On Monday, the average global temperature recorded by the US National Centers for Environmental Prediction (NCEP) was 17.01°C
- If you’ll excuse the pun, that proved to be a warm-up because the NCEP recorded an even higher new mark of 17.18°C on Tuesday July 4
Who gathers this info and how do they do it?
The data comes from a range of land and sea observations at locations around the world, which (as mentioned above) is compiled by the US National Centers for Environmental Prediction (NCEP).
The observations are combined with model data to create a global mean temperature.
Scientists at the University of Maine’s Climate Change Institute then analyse the NCEP figures and come up with the global average.
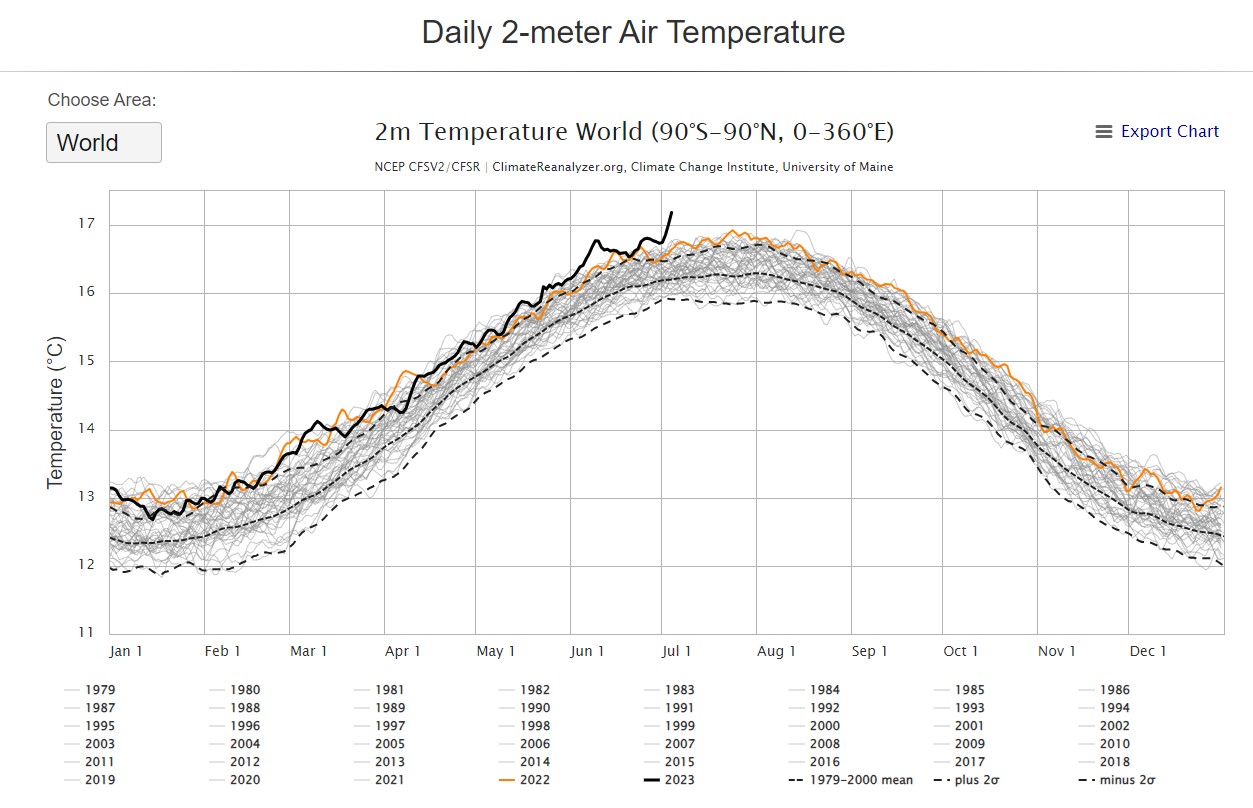
Image: Not the sort of record we like Source: University of Maine Climate Change Institute.
Perhaps the best representation of the data is in the above graph.
You can actually go to the website and hover over various data points to see the numbers, but the main thing to note at a glance is the black 2023 line. As you can see, this year has been trending near the top of the averages all year before the quite dramatic spikes this week.
Why so warm in 2023?
The developing El Niño has been cited as one factor for this year’s warm temps to date. Climate scientists also say there are unmistakeable signs of human-caused global warming in the data as emissions of CO2 and other greenhouse gases continue to trap heat.
Record-low Antarctic sea ice and the associated very high air temperature anomalies in that region are also helping to push up the global temperature anomaly.
Why do global heat records always occur in the Northern Hemisphere summer?
Extremes of both hot and cold usually occur on land because oceans tend to moderate surface temperatures. The Northern Hemisphere has much more land than us southerners, so that’s why the global peak for heat always occurs in the northern summer while the earth’s coolest time of year is the northern winter.
That’s not to say that the Southern Hemisphere has not contributed to this week’s heat anomaly. While parts of Africa have registered temps well in excess of 50°C this week, Antarctica again played quite a significant role.
Take a look at the image below for Wednesday July 5. In a continuation of recent trends, vast parts of the continent and nearby waters are much warmer than usual.
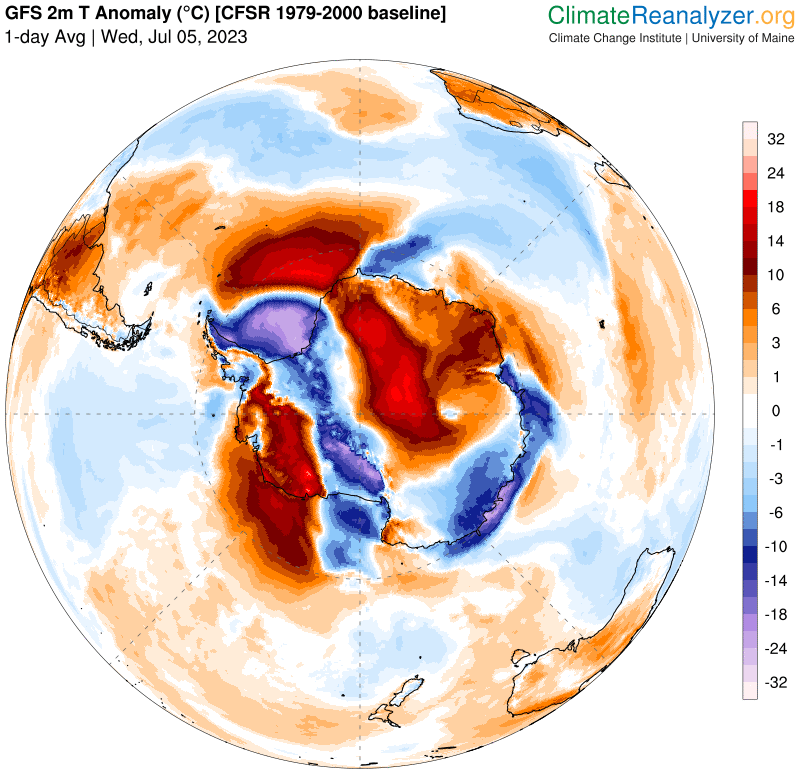
Image: it’s warmer than average across vast parts of the globe, from north to south and east to west. Source: University of Maine Climate Change Institute.
Meanwhile the UK sweated through its hottest June on record, and Australia just had its 7th-warmest June on record with a national area-average mean temperature of 1.12°C above the long-term average.
DTN APAC has a variety of forecasting and alerting tools on hand to help your business cope with the challenges that an El Niño can bring. For example, with the increase in bushfire risk, our hotspot detection will alert you to nearby fires (even small ones) so you can take action to protect your personnel and assets. To find out more please visit our website or email us at apac.sales@dtn.com.




