
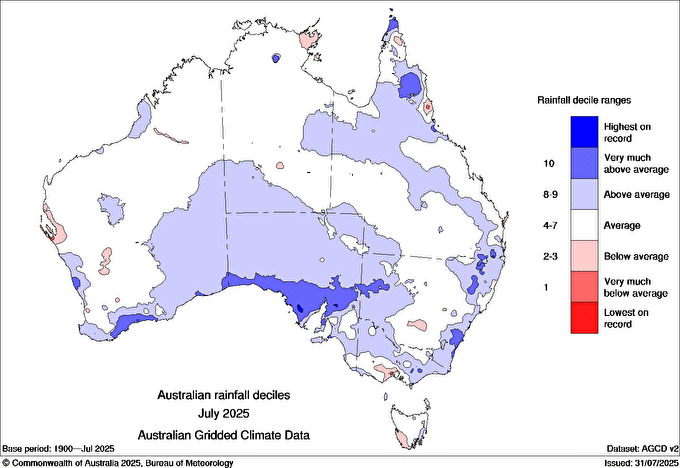
After a period of prolonged rainfall deficiencies, large parts of South Australia have finally enjoyed a much wetter-than-average month, with July 2025 being the wettest in 27 years.
South Australia’s statewide July average rainfall of 30.5mm doesn’t sound like a huge amount in raw terms, but it includes relatively low totals from the state’s far north. In short, July 2025 was:
- South Australia’s wettest July since 1998
- 57% above the state’s long-term July rainfall average of 19.43mm
- Just the second month to date in 2025 with above-average statewide rainfall
- The wettest July in over 100 years of records at numerous locations
The chart below shows South Australian rainfall deciles in July 2025.
As you can see from the dark blue patches, rainfall was very much above average in parts of the state’s south, including the desperately dry Eyre and Yorke peninsulas.
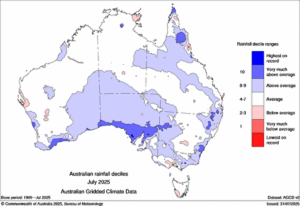
Image: Australia-wide rainfall deciles in July 2025. Source: BoM.
The only other month so far this year with above-average rainfall in South Australia was March.
The rainfall deciles chart painted a very different picture that month, with South Australia’s south enduring ongoing deficiencies while some spots in the north like Oodnadatta (38mm for March) and Coober Pedy (47mm) welcomed tropical moisture that travelled all the way from Queensland.
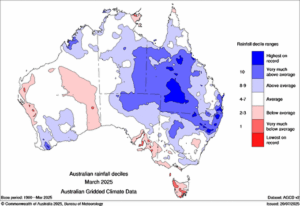
Image: Australia-wide rainfall deciles in March 2025. Source: BoM.
In other words, July was the first month this year to deliver significant rainfall to the state’s key agricultural regions, although some areas (like the Riverland) only saw moderate falls.
What about Adelaide in July?
As for the state capital, Adelaide enjoyed 111.2mm of rainfall in July 2025, nearly double its monthly average of 65.6mm.
Adelaide also received slightly above-average rainfall in June – and indeed the first month of the 2025 winter broke an 11-month streak of below-average rainfall going back to July 2024. This is the first back-to-back above average rainfall months since a the three consecutive months of above average rainfall from November 2023 to January 2024. As seen in the graph below, Adelaide remains well below it’s “running average” for the past 18 months, a deficit of nearly 300mm.
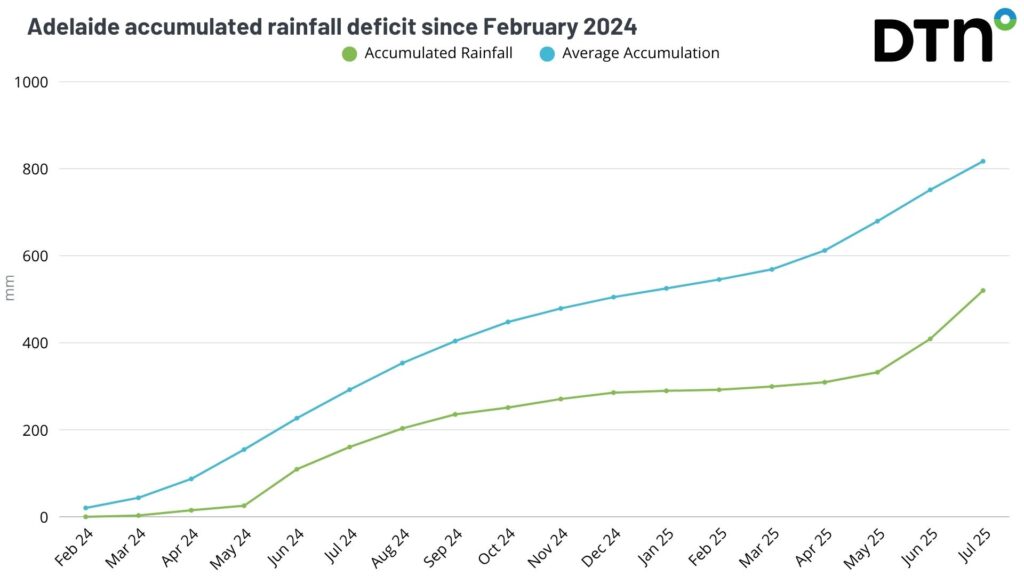
Image: Adelaide’s accumulated rainfall (green) and typical rainfall (blue) across the 18 months from February 2024 to July 2025.
Is the drought over?
Recent wet months have helped reduce rainfall deficits across Adelaide and the state, however more above-average rainfall months are needed to overcome the long-standing 1-2 years deficiencies across the state. As seen in the 18-month Australian rainfall deciles below, much of South Australia, Victoria and Tasmania remain in their lowest rainfall on record.
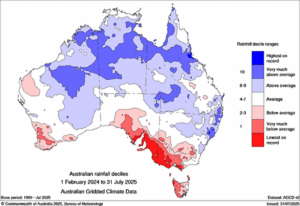
Image: Australia-wide rainfall deciles in the 18 month’s from February 2024 to July 2025. Source: BoM.
A favourable forecast for above-average rainfall is indicated over the end of winter and start of spring as a potential negative IOD event starts to influence South Australia’s weather, bringing a hopeful outlook in overcoming these long-standing deficits.
What about Australia as a whole in July?
Australia as a whole was slightly wetter and slightly warmer than average in July 2025.
The average nationwide temperature was 0.6°C above the long-term average, while rainfall was 8% above average nationwide.
The influence of the warming climate was impossible to ignore, with each state and territory registering temperatures above the long-term average.
Despite consistent snowfalls in the mainland alpine region that has led to a snowpack approaching two metres by the end of July, NSW and Victoria saw average statewide temperatures that were 0.83°C and 0.86°C above the long-term average respectively.
How DTN APAC can help
The shifting climate is bringing increased complexity and greater risks to businesses worldwide. We are here for you, delivering trusted weather solutions to optimize your operations and profitability.
DTN APAC is a diverse team, with global forecasting, product development and analytics expertise. Couple this with extensive industry experience spanning Aviation to Energy, and we are primed to assist you in strengthening your response to weather impact.
We work hard to identify your operational pressures and tailor our services and products to meet your needs. Concise communication, giving you full situational awareness exactly when you need it, is our focus. We want to reduce weather risk in your operations, every day.
We deliver clear and comprehensive weather data that you can’t get anywhere else, personalised risk assessments and briefings to you and your team, so that your critical decisions can be made with confidence.
We are available 365 days a year, so you always have the timely guidance you require, especially when severe conditions hit.
You have our insights to rely on to see you through complex situations, minimising potential loss of profit and maximising the safety of your staff and assets.
Learn more about our large range of industry leading products and services or email us at sales.apac@dtn.com






