
May is on track to become the 14th consecutive month of record-breaking global ocean warmth, despite clear signs of La Niña emerging in the tropical Pacific Ocean.
Global sea surface temperatures have broken records in every month since April 2023 and May is now on track to become the 14th consecutive month to set a record for ocean warmth.
The graph below shows daily global sea surface temperatures between 1979 and 2024 according to the ECMWF’s highly regarded ERA5 dataset.
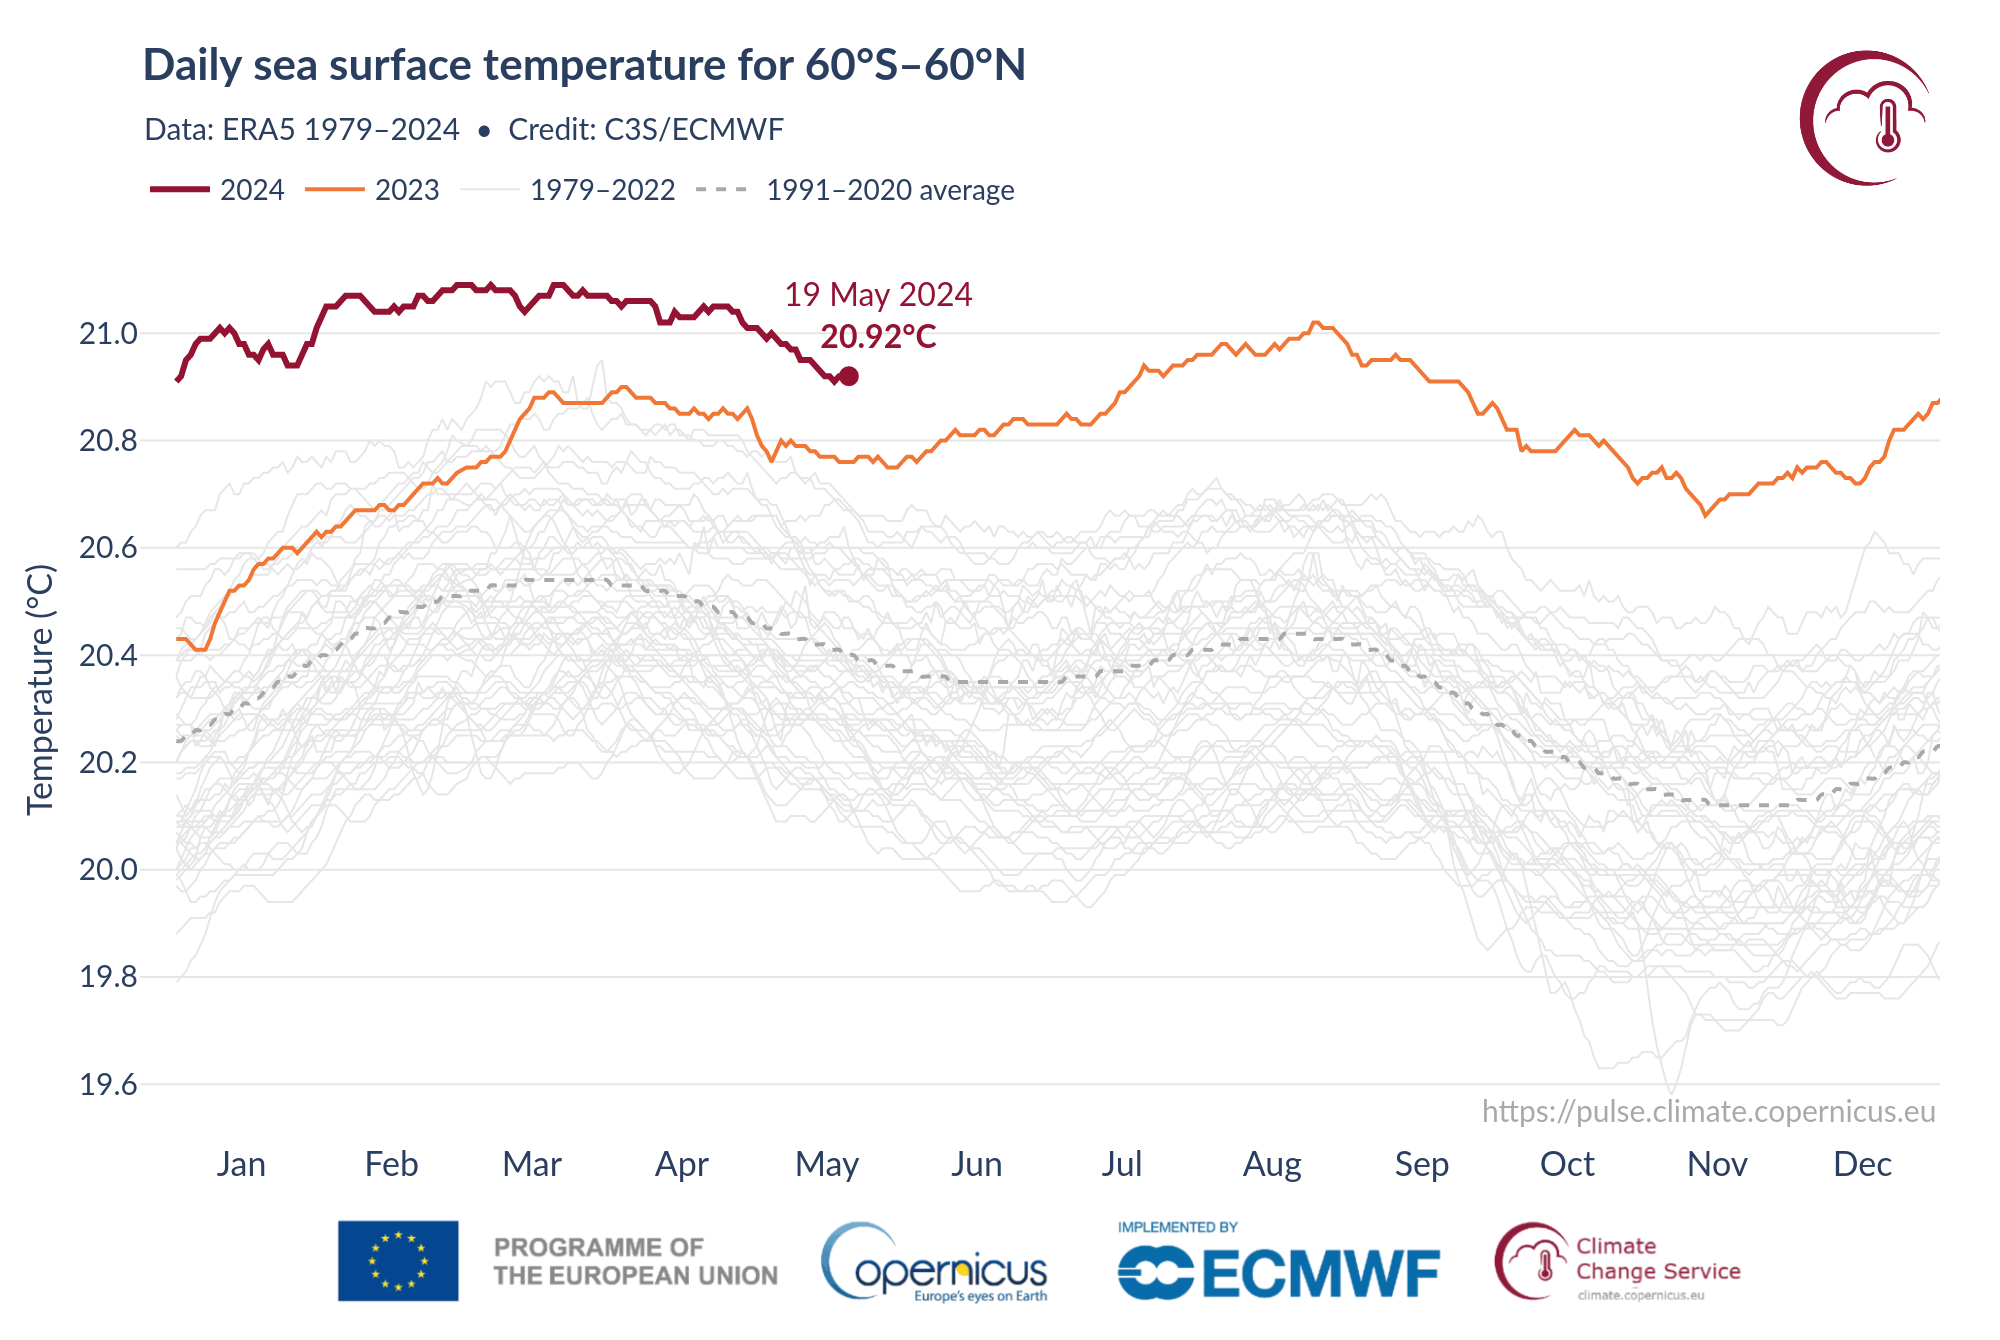
Image: Daily global sea surface temperatures between 1979 and 2024 using ERA5 data. Source: ECMWF/C3S
The thick dark line near the top of the graph is 2024 to date and the orange line below it is 2023. As you can see, all of 2024 and most of 2023 have been warmer than any other similar period on record, by a clear margin.
May 2024 is clearly warmer than May 2023 and is on track to become the 14th month in a row to set a new global sea surface temperature record.
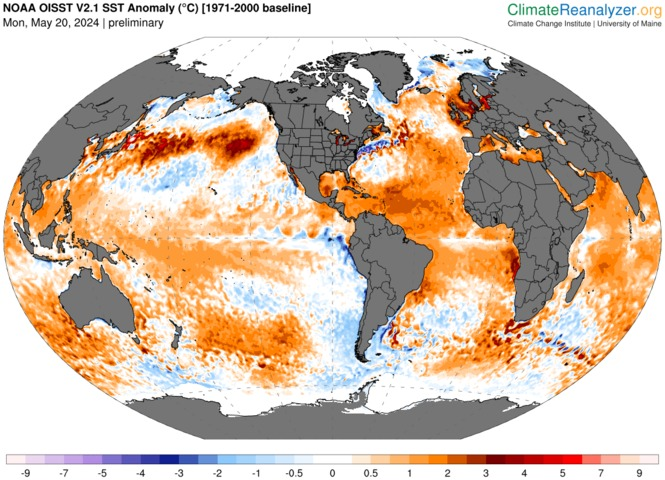
The map below shows how ocean warmth is currently being distributed across the planet, with orange and red colours showing areas that are warmer than average for this time of year. Blue shading represents areas that are cooler than average for late May.
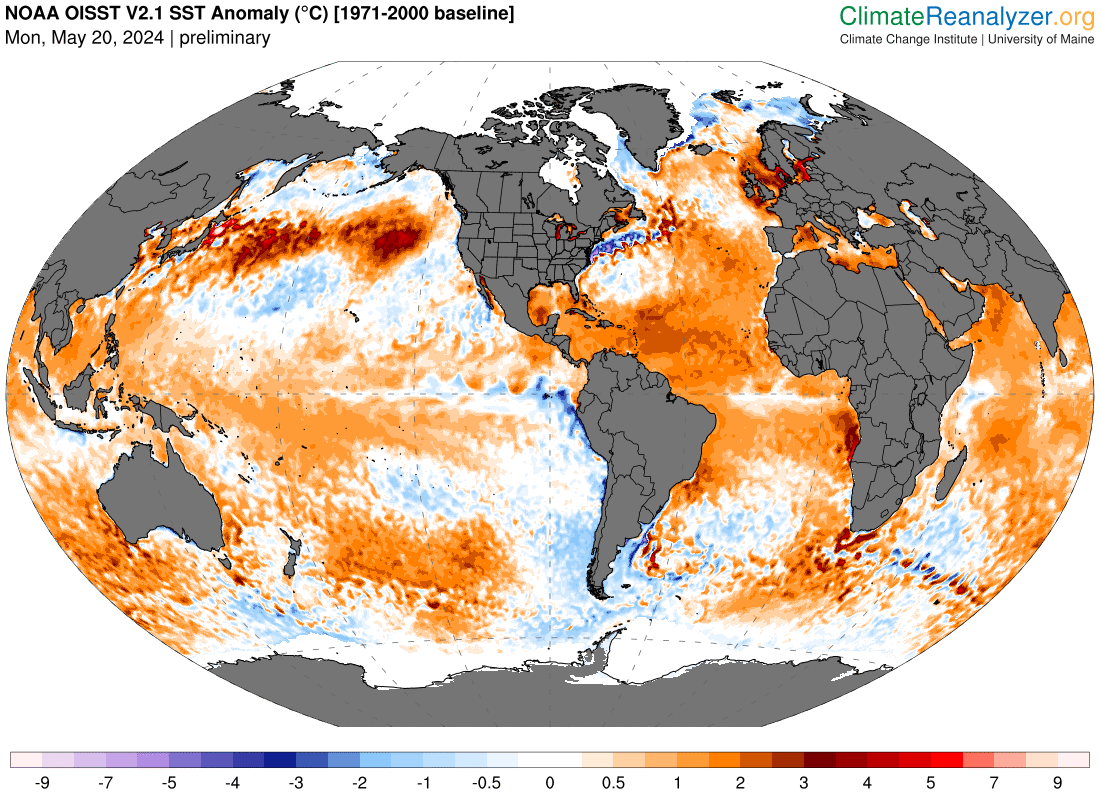
Image: Global sea surface temperature anomaly on May 20, 2024, according to the OISST V2.1 dataset. Source: ClimateReanalyzer.org
While there are some broad areas of blue on the map above, the red and orange colours are more dominant and in some places more intense.
One of the notable areas of excessive warmth is the North Pacific Ocean between Japan and North America. This broad area of abnormally warm water is associated with a negative phase of the Pacific Decadal Oscillation (PDO).
There is also a small tongue of cooler-than-average water in the eastern tropical Pacific Ocean, associated with the early phase of a developing La Niña pattern. While a mature La Niña can noticeably reduce the global ocean temperature, this developing La Niña pattern is currently too small to have a significant influence of global average sea surface temperatures.
The reasons for this 14-month run of record-breaking global ocean warmth are an area of active research, although some of the most likely contributing factors include:
- Ongoing warming due to climate change
- Additional warming from natural variability (e.g. a negative PDO)
- Enhanced ocean warming due to reduced air pollution (e.g. reduction in sulphur dioxide emissions from ships)
With temperatures currently running above average over so much of the Earth’s oceans, it is possible that this record-breaking run of heat will persist even further into 2024.
The shifting climate is bringing increased complexity and greater risks to businesses worldwide. We are here for you, delivering trusted weather solutions to optimize your operations and profitability.
DTN APAC is a diverse team, with global forecasting, product development and analytics expertise. Couple this with extensive industry experience spanning Aviation to Energy, and we are primed to assist you in strengthening your response to weather
impact.
We work hard to identify your operational pressures and tailor our services and products to meet your needs. Concise communication, giving you full situational awareness exactly when you need it, is our focus. We want to reduce weather risk in your operations, every day.
We deliver clear and comprehensive weather data, personalised risk assessments and briefings to you and your team, so that your critical decisions can be made with confidence.
We are available 365 days a year, so you always have the timely guidance you require, especially when severe conditions hit.
You have our insights to rely on to see you through complex situations, minimising potential loss of profit and maximising the safety of your staff and assets. For more information, please contact us at apac.sales@dtn.com.




