The Southern Annular Mode (SAM) has reached its most positive value in close to two years – but has impacted Australia’s industries in a different way than usual.
What is the Southern Annular Mode?
All year round, a belt of powerful winds flows around the Southern Hemisphere surrounding Antarctica. This wind belt flows from west to east and passes to the south of Australia, carrying strong low pressure systems and cold fronts across the Southern Hemisphere.
In the warmer months of the year, the westerly wind belt shifts further south, typically a long way to the south of Australia. This is why southern Australia doesn’t see many strong cold fronts or low pressure systems in the summer months.
During winter, however, the westerly wind belt shifts further north, which exposes southern Australia to more frequent and stronger low pressure systems and cold fronts. Australia’s ski industry and southern Australian wind power, hydroelectricity and agriculture industries rely on the winds, rain and snow these lows and fronts typically deliver during wintertime.
The images below show the average strength and position of the westerly wind belt in winter (top image) and in summer (bottom image).
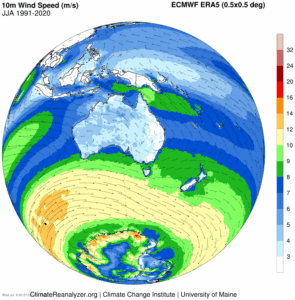
Image: Average 10-metre wind speed and direction in the Southern Hemisphere’s winter (June to August) during the 30-year period from 1991 to 2020. Source: ClimateReanalyzer.org
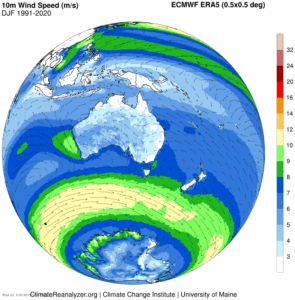
Image: Average 10-metre wind speed and direction in the Southern Hemisphere’s summer (December to February) during the 30-year period from 1991 to 2020. Source: ClimateReanalyzer.org
The Southern Annular Mode, commonly referred to by its acronym SAM, is an index that measures the north-south displacement of this westerly wind belt, relative to where it should be positioned at a given time of year.
A positive SAM occurs when the westerly wind belt is located further south than usual for that time of year. By contrast, a negative SAM happens when the westerly wind belt is positioned further north than usual for a given time of year.
In winter, when the westerly wind belt is already positioned close to southern Australia, a negative SAM typically makes cold fronts and low pressure systems become even more active than usual across Australia’s southern states. This can enhance wind, rain and snow in southern Australia. A positive SAM in winter can have the opposite effect, forcing the westerly winds, cold fronts and low pressure systems further south, reducing their influence on Australia’s weather.
As a rule of thumb, a negative SAM in winter usually means more wind, rain and snow in southern Australia, while a positive SAM often means less of these wintry weather systems. A positive SAM can also lead to more rain over Australia’s eastern states by enhancing the flow of moisture-laden easterly winds over parts of NSW and Queensland.
What is the SAM doing now?
The SAM index trended positive in late June and reached strong values of +3.38 on July 3 and +3.51 on July 7. This was the strongest positive SAM value since +3.84 on October 4, 2023.
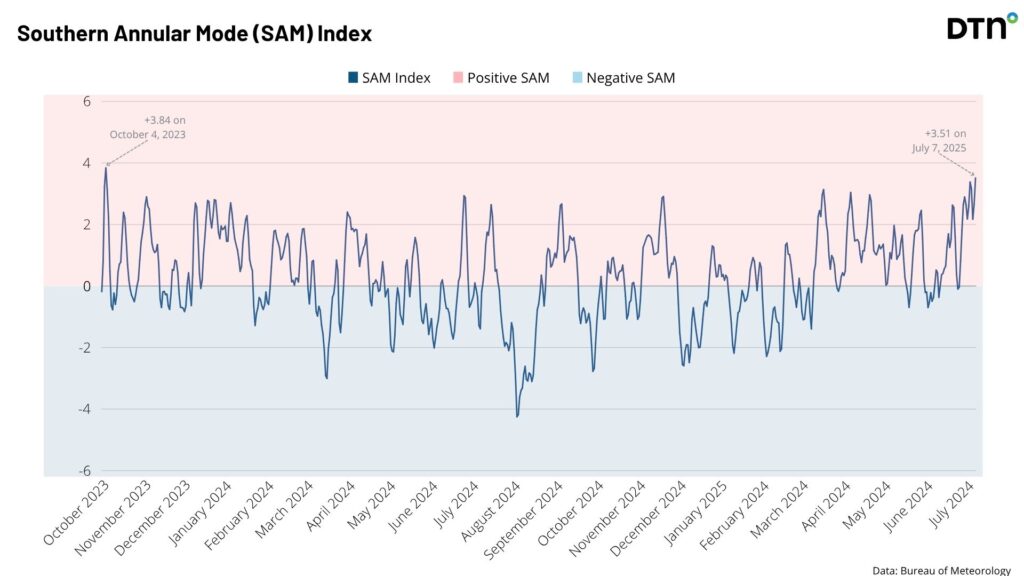
Image: SAM index values from October 2023 and July 2025.
This positive SAM has had a noticeable influence on Australia’s weather in the opening week of July, with reduced frontal activity over southern Australia and enhanced rain in the east.
The map below shows how much rain was recorded over Australia during the first 8 days of July. The heaviest falls over this period occurred in eastern NSW and eastern Victoria, driven by an East Coast Low.
Image: Observed rain during the first 8 days of July 2025. Source: Bureau of Meteorology.
There was also a reduction in the natural snow depth in Australia’s alpine region during the opening week of July due to the absence of any strong cold fronts.
Wind power generation also saw a period of low production in late June and early July as a result of the SAM going positive. This followed Australia’s highest wind energy generation ever on June 24, 2025 as the SAM dipped close to zero.
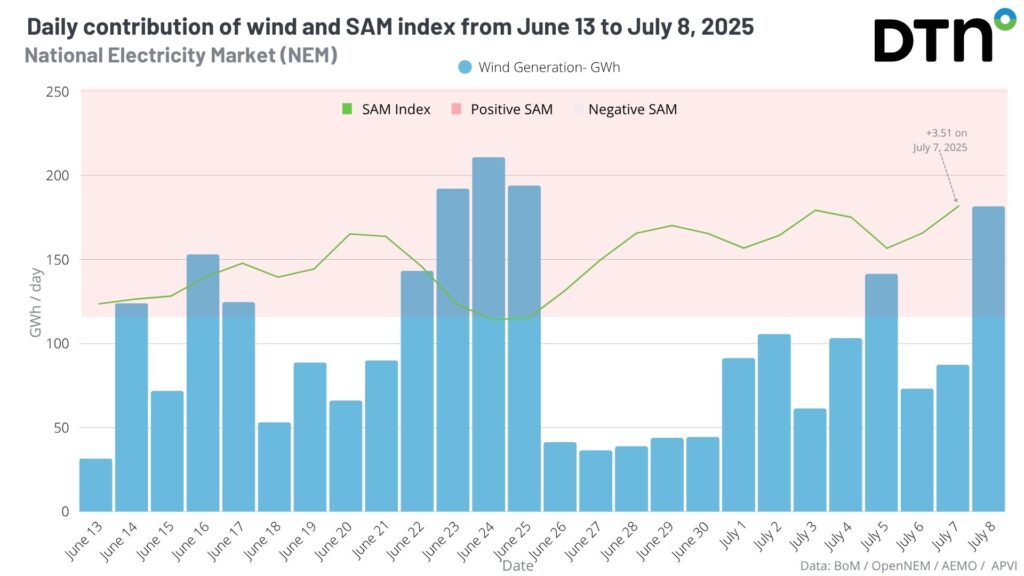
Image: Daily wind energy generation across the NEM (blue) and SAM index (green) from June 13 to July 8, 2025. Data source: OpenNEM
SAM losing control in the coming weeks
Looking ahead, the SAM is forecast to remain positive over the coming week but should gradually weaken and return to a more neutral phase after the middle of July.
Latest 1 month outlook graph for the Southern Annular Mode daily index
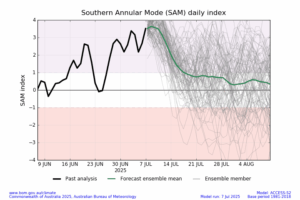
Image: Forecast SAM index for the next 3-4 weeks. Source: BoM
So, does that mean more dry weather and less wind in the south and more rain in the east? Not in this case.
Despite the SAM remaining positive for at least another week, the weather patterns being predicted over Australia in the coming week are not characteristic of a typical positive SAM event.
Southern Australia is experiencing strong winds, rain and snow, while the east coast remains dry, across most of the coming week. This is the type of weather we would typically expect to see under a negative SAM in winter, not a positive SAM.
This coming week’s weather is a good example of why the SAM is a good guide, but not always a clear indicator of what to expect. It’s not unusual to see periods where the weather in Australia doesn’t match the current SAM phase.
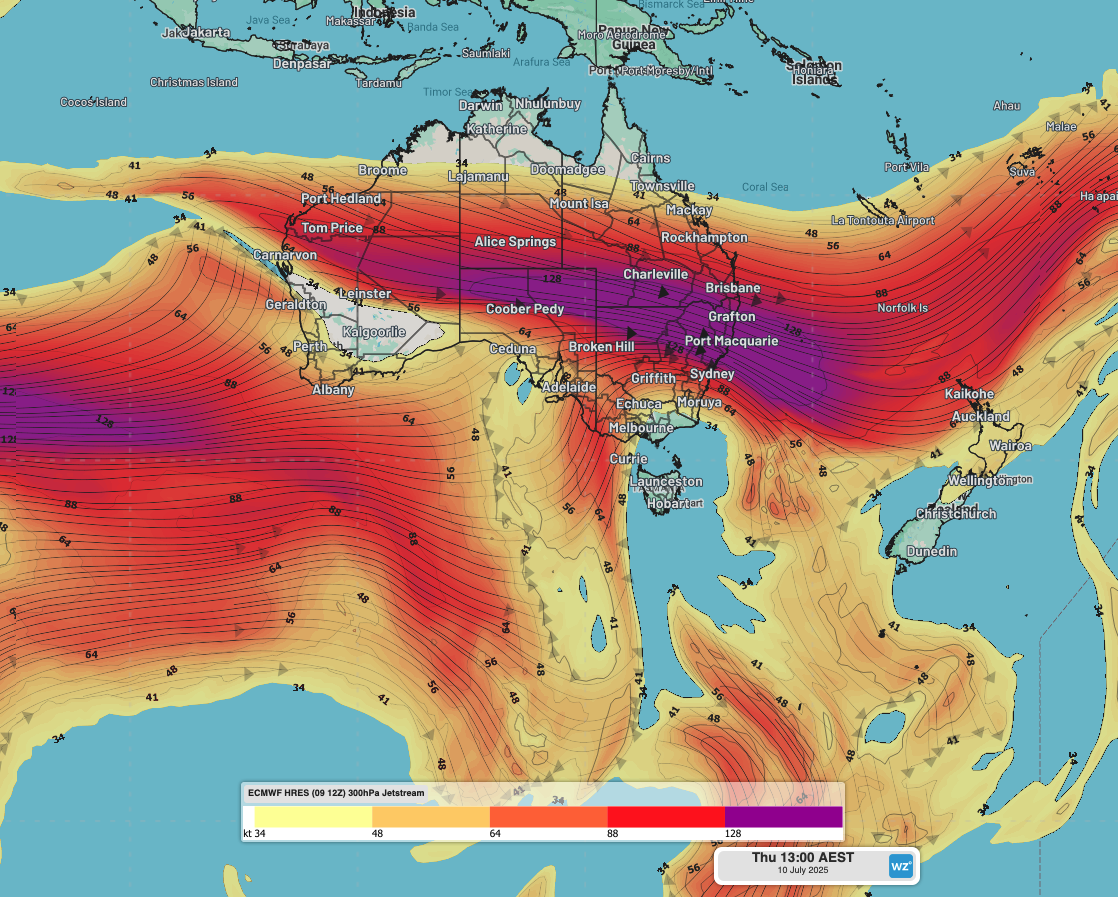
One example where this can happen is when a bend in the jet stream causes an outbreak of cold polar air over Australia’s longitudes, while frontal activity remains suppressed in other parts of the Southern Hemisphere.
Under this scenario, the average position of the westerly wind belt on a global scale might still be further south than usual, indicating a positive SAM, but the westerly wind belt is bending up towards Australia and causing an outbreak of wintry weather in that part of the Southern Hemisphere.
The map below shows one of these cold weather outbreaks hitting Australia later this week, represented by an extension of low mean sea level pressure towards the southeast of Australia. This ‘node’ of low pressure and cold air just happens to be positioned over the southeast of Australia, causing a surge of wintry weather despite the ongoing positive SAM.
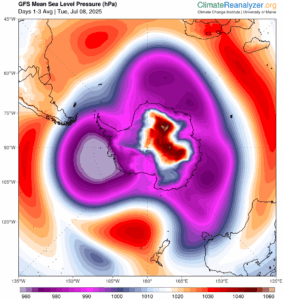
Image: Modelled mean sea level pressure over the three-day period starting on Tuesday, July 8, 2025. Source: ClimateReanalyzer.org
Across the wind power sector, snow and hydro industries and agriculture, this will be a rare case where there should be plenty of wind, snow and rain in southern Australia over the coming week even though a positive SAM remains in place.
How DTN APAC helps the renewable wind energy industry

Your customizable Energyzone interface and Weatherguard app will provide access to the Total Lightning Network as well as centralized data from state and territory fire agencies, the Bureau of Meteorology, and over 30 national and international private and state organisations. This enables full situational awareness of weather conditions and fire risk, as well as severe weather alerting via text, email and phone call, so your staff can respond effectively when required. Together we can keep your staff and assets safe, and efficiency high.
DTN APAC also offers seasonal and long-term outlooks covering wind, rainfall and extreme heat out to 12 months into the future. With renewables making up more of Australia’s energy mix every year, we want to support your business to make informed critical decisions and improve your overall generation and safety.

DTN APAC is a proud Gold sponsor of Australia Wind Energy 2025 Conference & Exhibition in Melbourne. Visit our Exhibition Booth A74, where our team of experts will walk you through our industry-leading weather solutions powering the Wind energy sector, as well as solutions that also support decarbonisation in the Mining industry.


