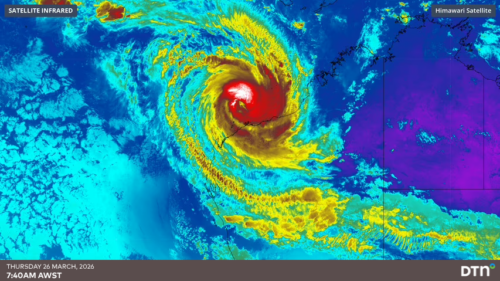
Sydney Airport has been grappling with the challenges posed by strong crosswinds, forcing the airport to operate on a single runway several times over the past few weeks. These gusty westerly-component winds (exceeding 20 knots or 37 km/h at times), blowing perpendicular to the north-to-south oriented runways, have created significant disruptions in flight operations, resulting in delays and cancellations that have affected numerous passengers.
Crosswinds at airports can be extremely hazardous for flight operations, particularly during take-off and landing. When the wind blows perpendicular to the runway, it generates a significant lateral force on the aircraft, making it difficult for pilots to maintain a stable trajectory. The strong crosswinds can cause the plane to drift off course, posing a serious risk to both the aircraft and its passengers.
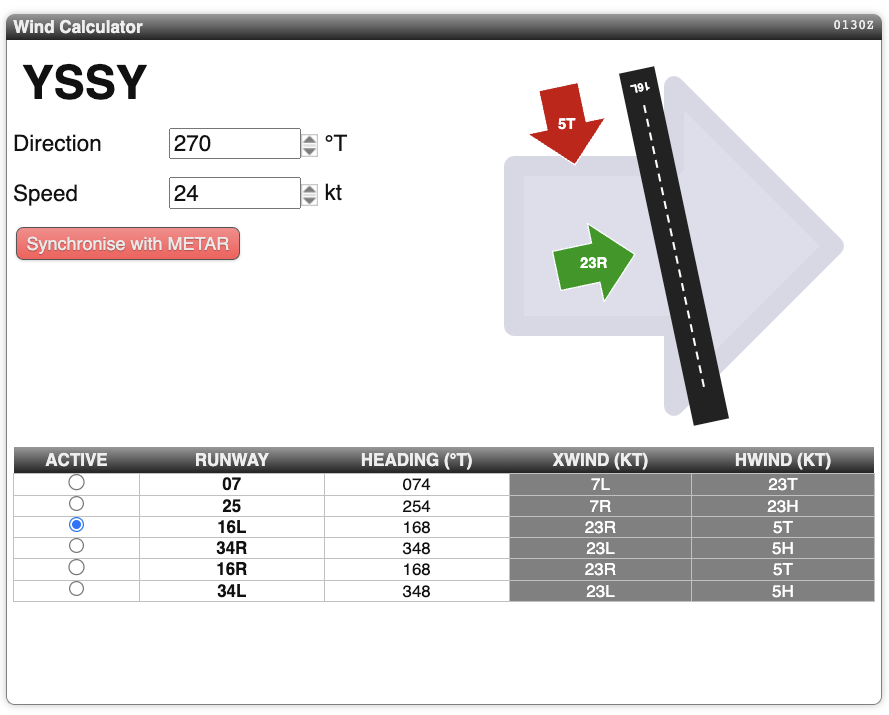
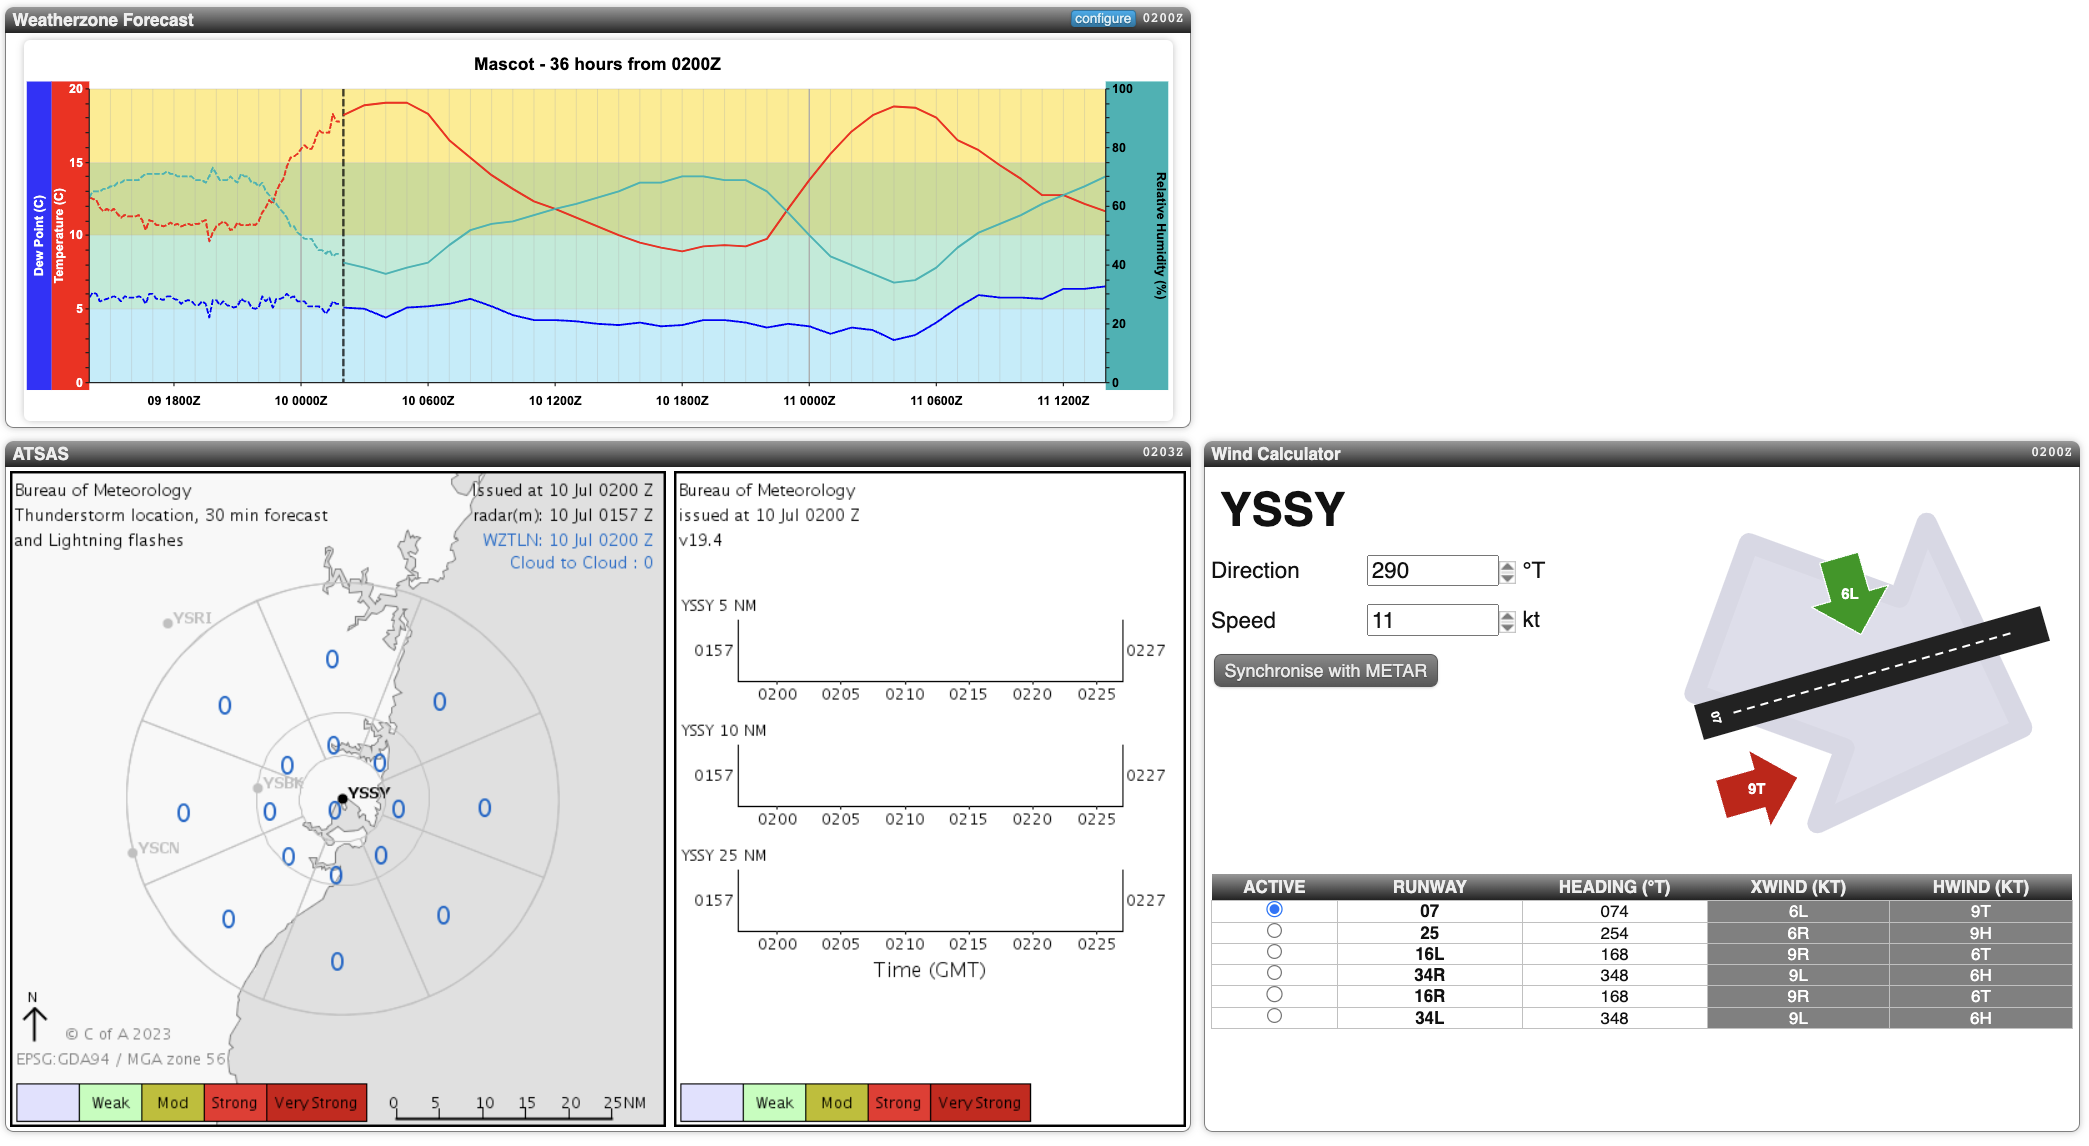
Image: Effect of the sustained 24 knot westerly winds on the runways at Sydney Airport over the weekend. Crosswinds are shown to come from either the left (L) or Right (R), while headwinds are either tailwinds (T) or headwinds (H). Calculated and displayed on the Weatherzone Aviation Dashboard.
But why have these strong westerly winds been observed so frequently in the south over the past few weeks, leading to operational delays at Sydney Airport? To understand this, let’s examine an index known as the Southern Annular Mode (SAM). The SAM refers to the north-south displacement of the powerful westerly wind belt that flows in the mid-to-high latitudes of the southern hemisphere. These westerly winds steer cold fronts and low-pressure systems that bring seasonal rain, snow, and wind to southern Australia. Therefore, the state of the SAM can noticeably influence the weather in different parts of Australia at various times of the year.
During a negative phase of the SAM the westerly winds and cold fronts shift further north towards Australia. In winter, negative phases of the SAM can enhance rain, wind, and snowfall across parts of southern Australia while reducing rain in parts of eastern Australia. Conversely, during a positive phase of the SAM, the belt of circumpolar westerly winds contracts towards Antarctica, away from Australia. A positive phase of the SAM during winter pushes rain and snow-bearing cold fronts further south and causes easterly winds to increase over eastern Australia. This typically leads to reduced rainfall and snowfall over parts of southern Australia and increased rain in parts of Queensland and New South Wales.
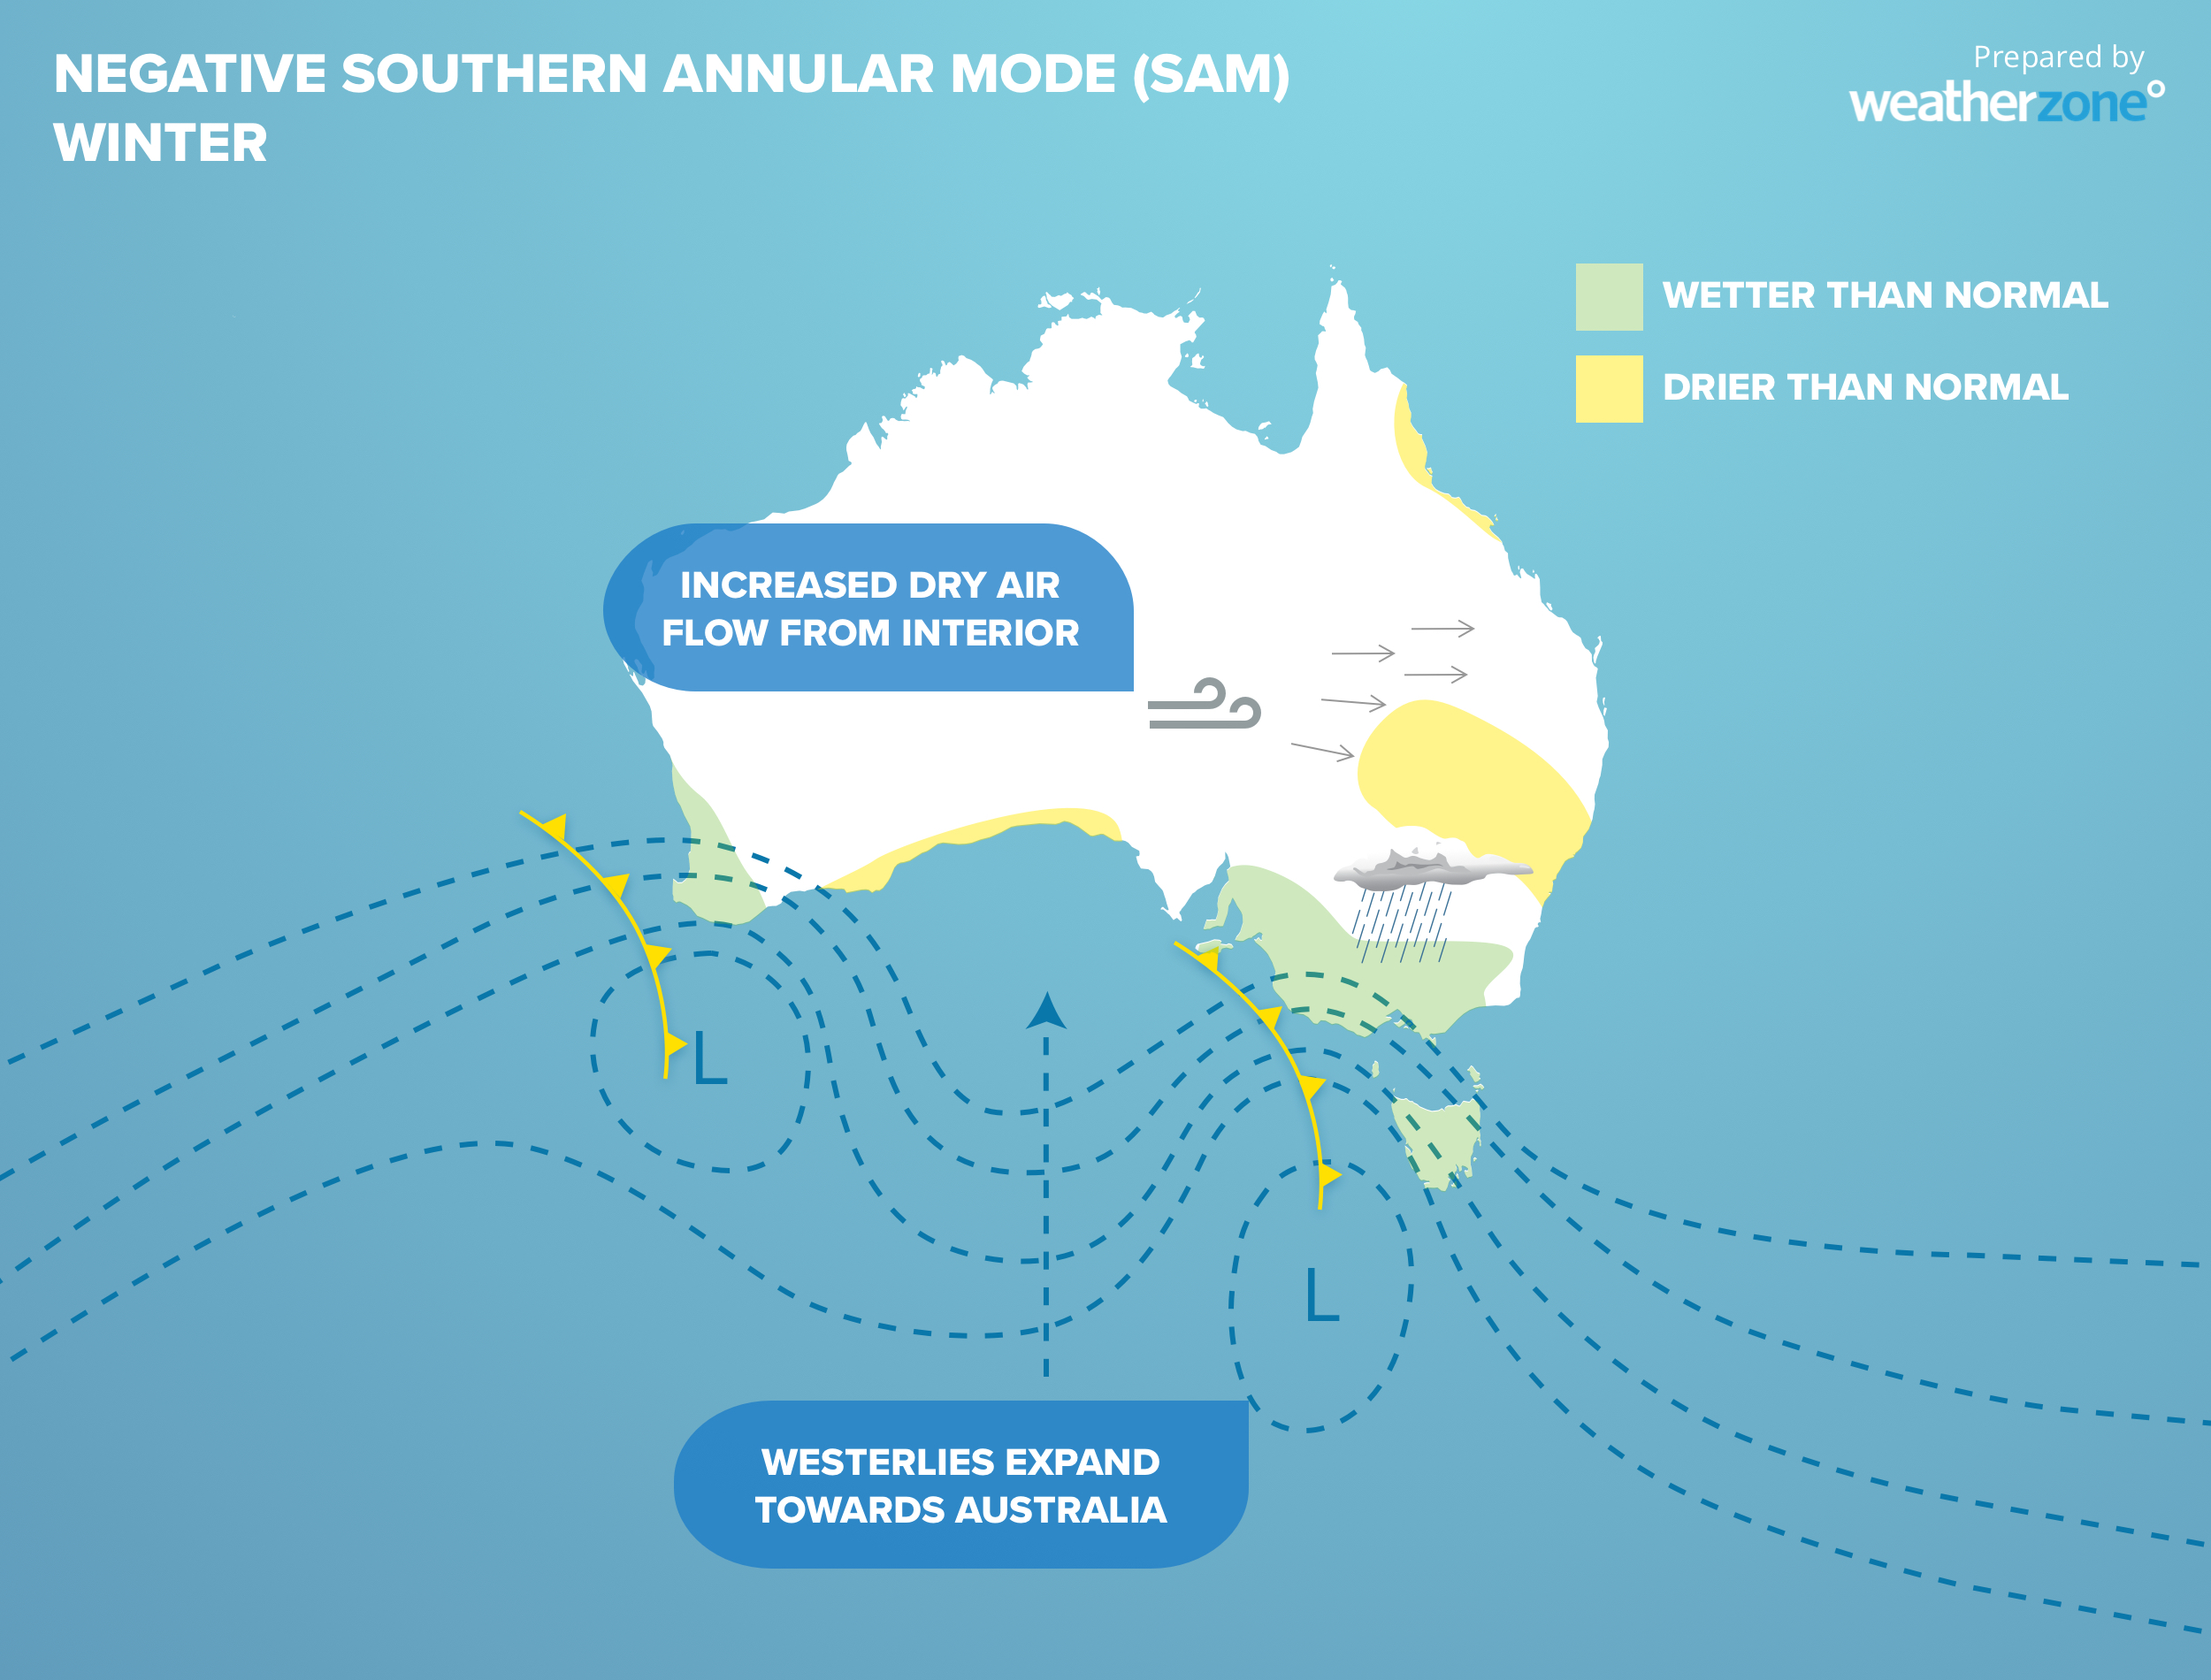
Image: Typical effects from a negative SAM during winter.
As seen in the graph above, the SAM has been in a negative phase since the last days of June and the first week of July. This is associated with a northward shift of the westerly winds, causing strong westerly winds to reach lower latitudes, including southeast NSW and Sydney.
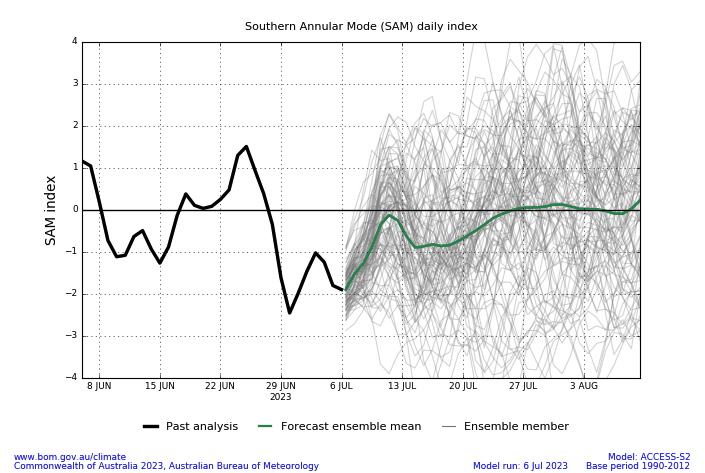
Image: Southern Annular Mode (SAM) daily index. Source BoM
Consequently, Sydney Airport has been forced to operate on a single runway, leading to the delay of hundreds of flights during this period. In the short term, despite some uncertainty, the graph indicates a higher inclination for the index to remain in a weaker but still negative phase for at least one or two more weeks. This, combined with the current wind forecast for the next two weeks, suggests an increased likelihood of Sydney Airport being compelled to use a single runway, particularly this weekend and possibly late next week. As we progress further into the month, the index tends towards a more positive phase, indicating that strong westerly winds will become less likely over southern parts of Australia, including Sydney.
DTN APAC has all your aviation needs covered, with our aviation dashboard. We have all the regular forecast and observations tools available for each airport in Australia and all major airports around the world. 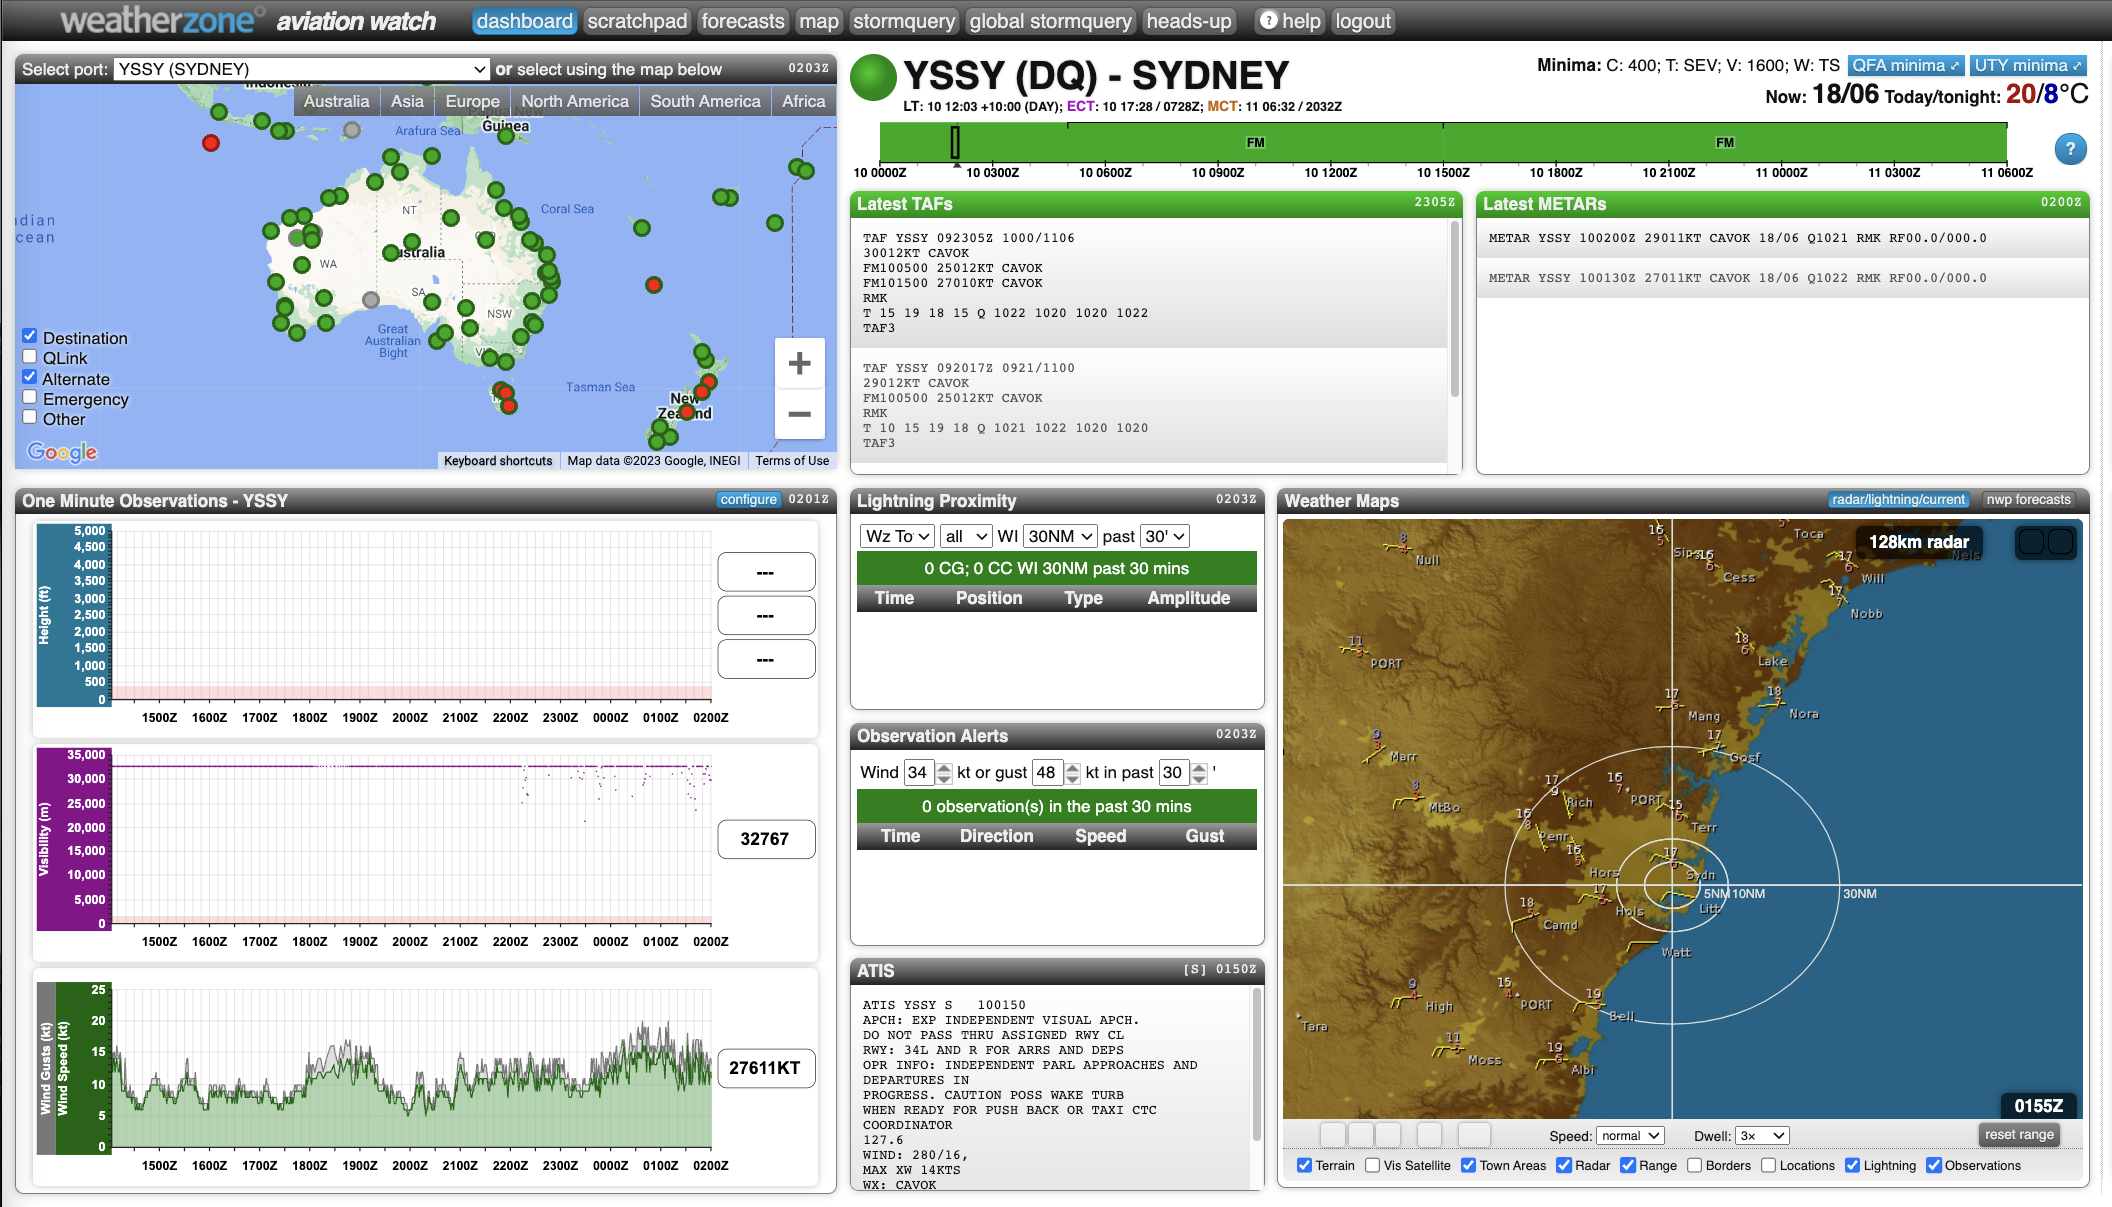
Whats more, is it links up to the Total Lightning Network (WZTLN), our industry leading detection of lightning strikes to within 100m accuracy. Lightning strikes are alerted on the dashboard, including time, position, type (cloud-cloud or cloud-ground) and the amplitude of the strike (including if it was positively or negatively charged).
To find out more about Weatherzone’s Aviation services, please visit our website or email us at apac.sales@dtn.com.