
Sydney is now having its wettest March since 1956 as the city continues its wettest start to a year in record.
Like much of eastern NSW, Sydney hasn’t seen much sun or dry weather this month. This persistent run of wet and gloomy weather has been caused by relentless onshore winds drawing moisture from an unusually warm Tasman Sea and driving it across the state’s coast and ranges.
Sydney’s Observatory Hill rain gauge collected 57.4 mm during the 24 hour to 9am on Tuesday, bringing its running monthly total up to 509.4 mm. That’s now half a metre of rain in a month that has a long-term average of just 132 mm.
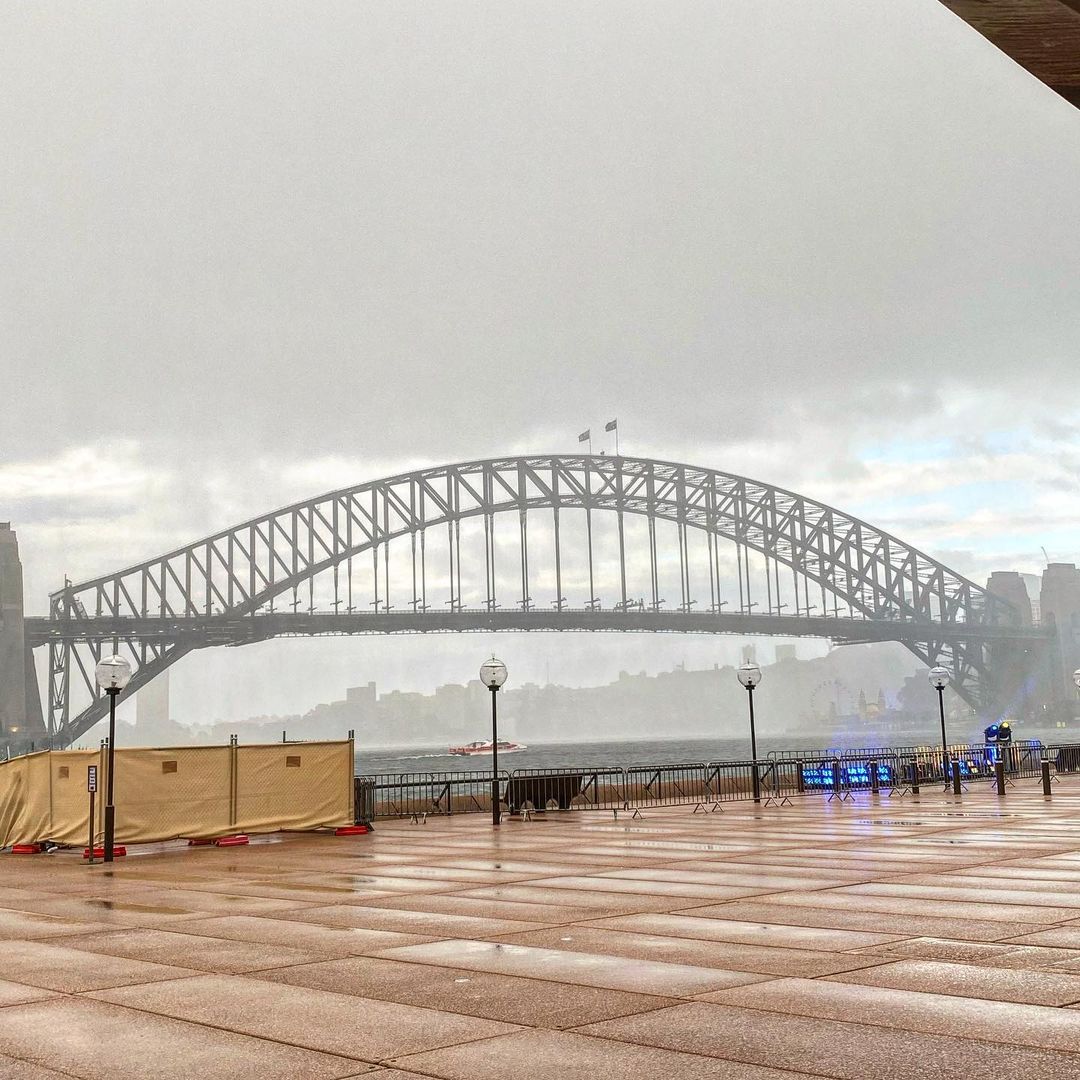
Image: March 2 was one of Sydney’s many soggy days this month. Source: @cathiesomerville / Instagram
Sydney’s running monthly total of 509.4 mm at 9am on Tuesday is the city’s 2nd highest March total on record, beaten only by 521.4 mm in 1942. If Sydney picks up more than 12 mm before the end of the month, which seems likely at this stage, this will become the city’s wettest March on record.
As of 9am on Tuesday, March 2022 had also become Sydney’s wettest calendar month since June 2007 (510.6 mm) and the 11th wettest calendar month on record.
Sydney’s record-breaking March comes after the city’s 11th wettest February in records dating back to 1859.
Unsurprisingly, this sodden start to 2022 has resulted in Sydney’s wettest start to a year on record. The city’s running annual total up to 9am on Tuesday, March 29 was 1031.6 mm, beating 1023.1 mm to the same date in 1956. These are the only two years in records dating back to 1859 that managed to amass more than 1000 mm by this point in the year.
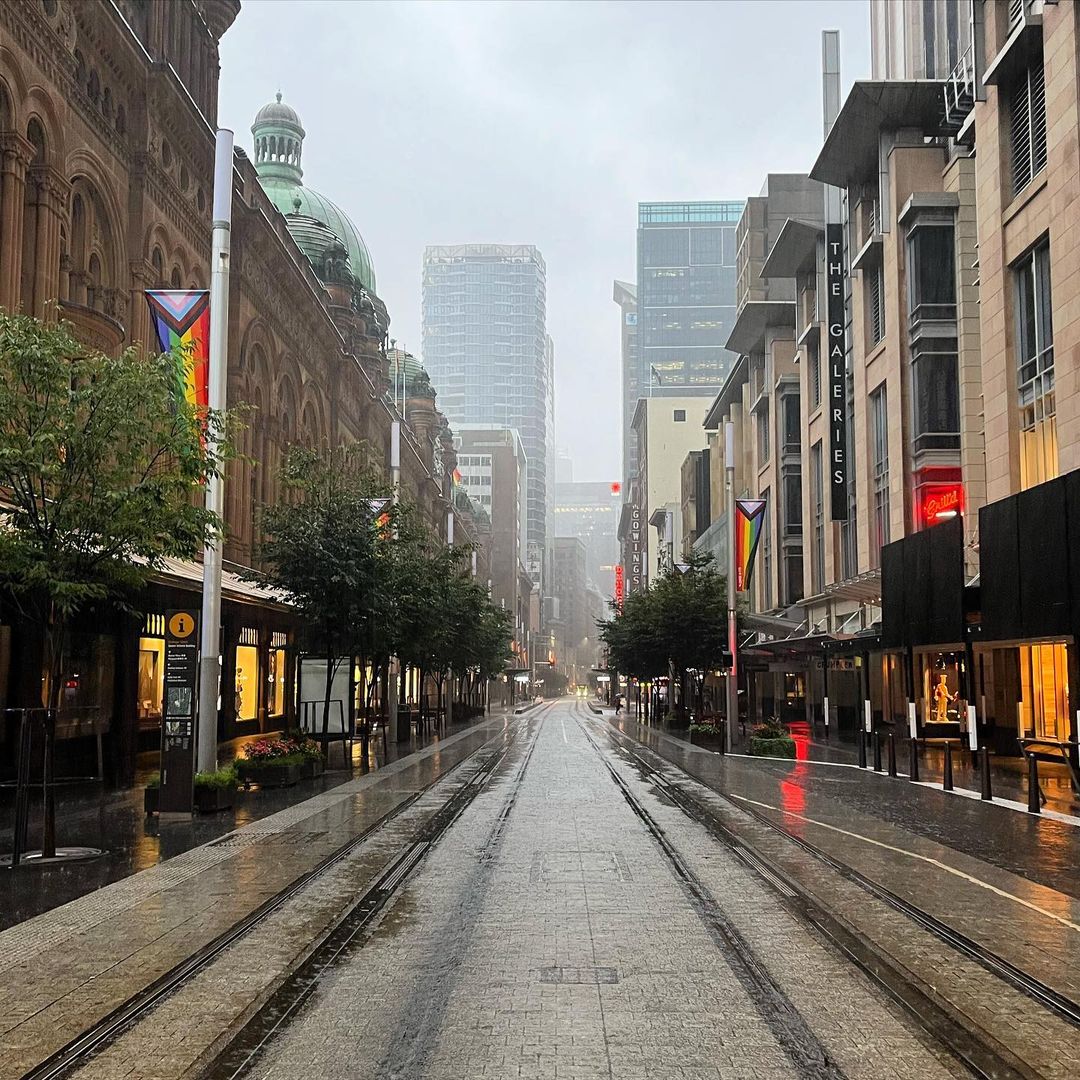
Image: Slippery streets have been common in Sydney this month. Source: @abhi__insta / Instagram
But it is not just the amount of rain that has been impressive in Sydney this month. The city also had fleeting sunshine and barely any dry days.
Sydney’s Observatory Hill weather station only had five days without any rainfall so far this month, which is the equal lowest number of dry days on record for March, matching the same feat in 1870.
It has also been a gloomy month, with Sydney Airport averaging just 4.46 hours of sunshine per day up to 9am on Tuesday. This is the cloudiest March since 4.39 hours of sunshine per day in 1989.
Sydney’s official monthly rainfall figure for March will be available after 9am on Thursday, March 31. For more information on Weatherzone’s solar and rainfall forecasts, please contact us at apac.sales@dtn.com.


