

A strong El Niño and an unusually stable Antarctic polar vortex are setting up a spring signal of light winds, elevated solar output, and a real risk of high-intensity heatwaves for the NEM.
This forecast could be a major flip to what the National Electricity Market (NEM) has experienced so far during Winter 2026. On 1 July 2026, the NEM set a new all-time wind generation record of 10,349 MW at the 21:20 dispatch interval – 190 MW above the previous record (10,159 MW, set in July 2025) – and that peak occurred with roughly 450 MW of wind still being curtailed at the time.
Off the back of that run of records, the past week has shown signs of a potential lull with wind’s contribution easing back from the levels that produced July’s record-breaking peaks. Worth watching over the next few weeks to see whether this becomes the sustained light-wind pattern the spring outlook points to, or just normal week-to-week variability before wind picks back up.
Understanding why comes down to one climate driver operating in the background all season – the Southern Annular Mode (SAM).
What is the SAM?
The Southern Annular Mode describes whether the belt of strong westerly winds circling Antarctica is contracted poleward (positive SAM) or expanded and shifted toward the mid-latitudes (negative SAM). It’s essentially the surface expression of the stratospheric polar vortex above it, when the vortex is strong and stable, the westerlies stay locked up close to Antarctica; when the vortex weakens, that wind belt loosens and pushes further north over the Australian mainland.
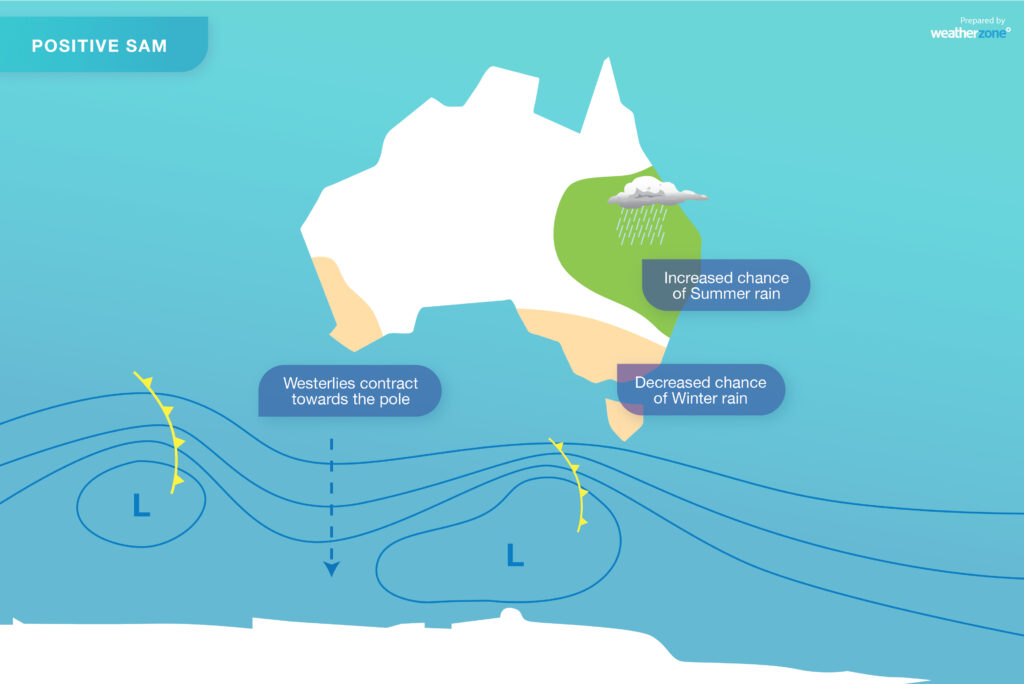
For southeastern Australia, a positive SAM typically means:
- Weaker, less frequent cold fronts and troughs crossing the mainland
- More persistent high-pressure ridging
- Calmer, lighter winds away from the mid-latitude storm track
- Warmer and drier conditions than average
A negative SAM does the opposite – it drags the storm track and its associated wind and rain further north over the country.
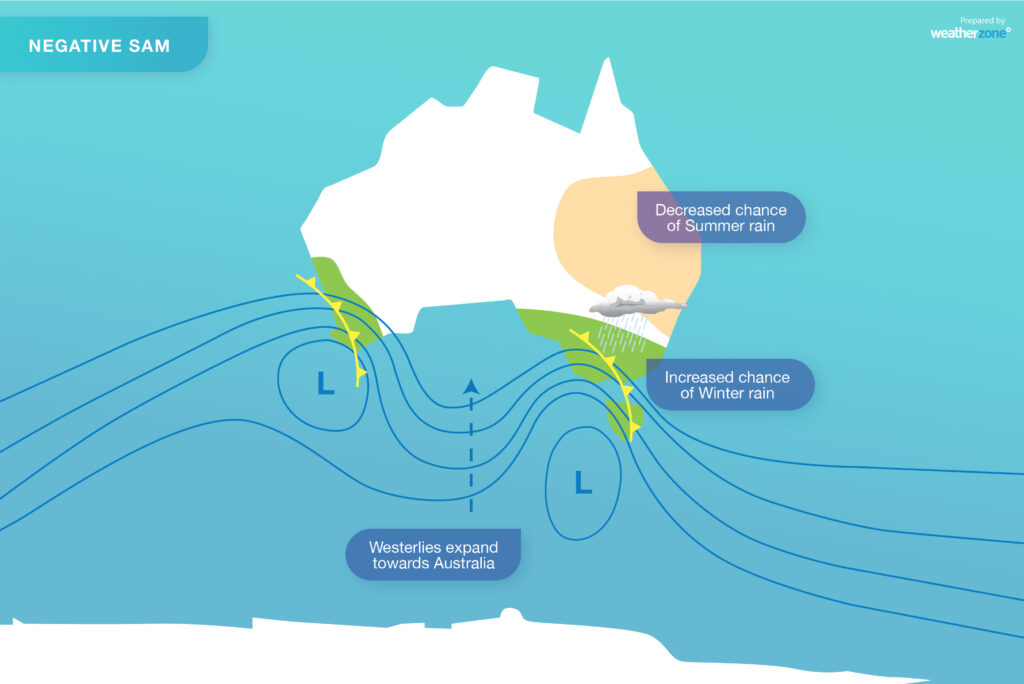
Separately, El Niño has its own influence on SAM: it tends to push the SAM negative during spring and summer. So, the net outcome each spring depends on which the balance of El Niño.
Past El Niño events impacting spring in 1997, 2015, and 2023
The last three springs that were in an El Niño phase, were 1997, 2015 and 2023 and during these years the SAM phase was varied.
Spring 1997 – strongly negative SAM.
One of the most extreme El Niño events on record. El Niño dominated outright, driving the SAM strongly negative through spring running negative.
Spring 2015 -offset, near-neutral SAM.
This was also a strong El Niño year, but this time a robust, stable stratospheric polar vortex pushed back against El Niño’s usual negative pull. The two effects largely cancelled out, leaving SAM close to neutral rather than sharply negative – a case where the vortex meaningfully blunted the El Niño signal.
Spring 2023 – negative, then flipping positive.
SAM started negative in September, then swung strongly positive through November and December as an unusually large, long-lived ozone hole reinforced the polar vortex. El Niño and a positive Indian Ocean Dipole combined with that late-season positive SAM to produce Australia’s driest August–October on record.
The maps below show that across all three years, the wind anomaly pattern over southern and central Australia was consistently lighter than average in spring, regardless of what SAM itself was doing.
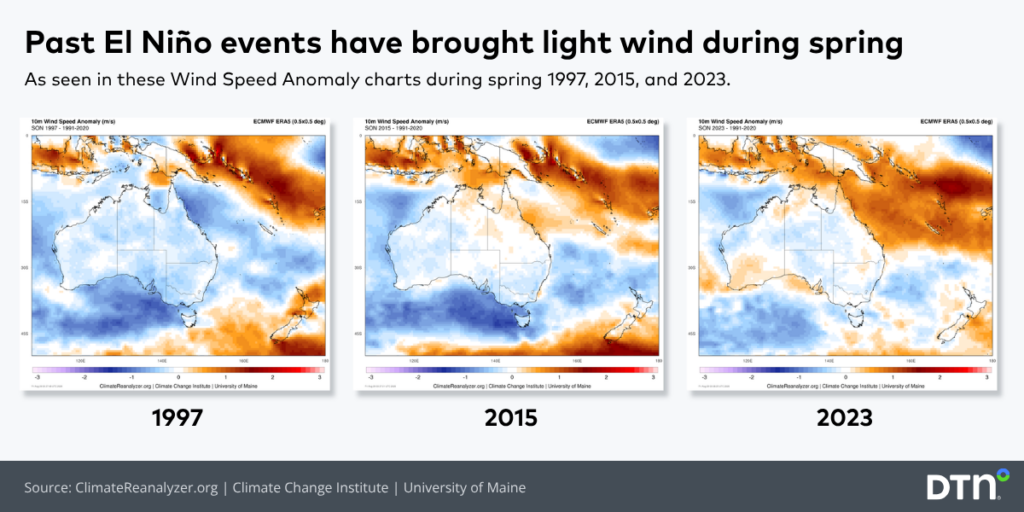
The charts above show that El Niño’s ridging and subsidence is a direct driver of the light-wind signal, with SAM acting more as a modulator of where that pattern sits and how far it extends.
Why this spring 2026 looks different for Australia
Two things distinguish this year from the analogue set:
- A stable, largely undisturbed polar vortex through winter is pointing toward a positive SAM signal persisting into spring.
- A strong El Niño already in place, which independently drives subsidence and ridging over the Australian mainland.
Rather than these two signals cancelling out (as in 2015), El Niño-driven subsidence and a positive-SAM-contracted storm track both point toward lighter winds and more persistent high pressure over the NEM footprint.
The Mean Sea Level Pressure (MSLP) forecast maps for September, October and November reflect this with high pressure sitting over southern Australia, showing El Niño’s subsidence and potential for a positive SAM phase.
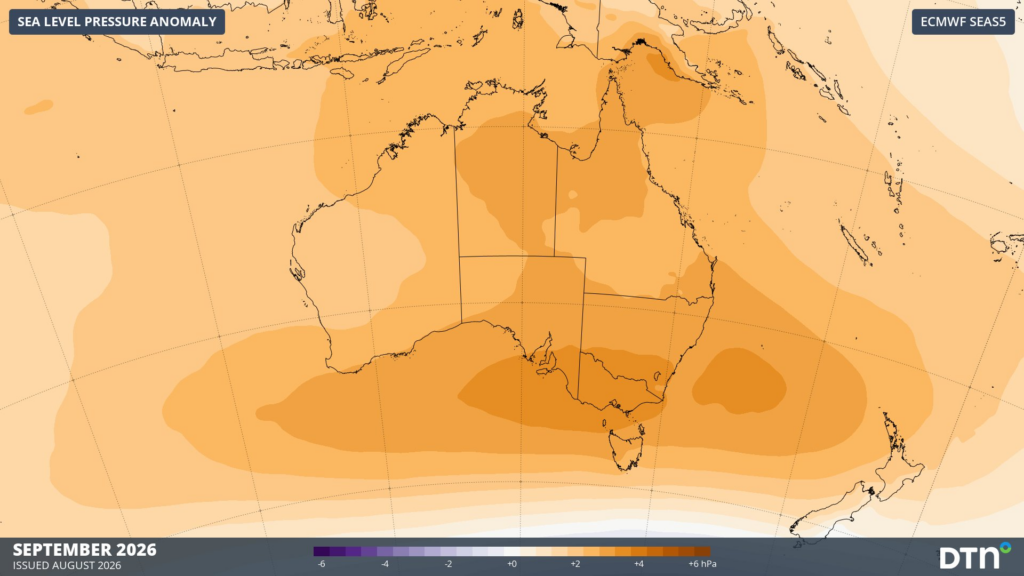
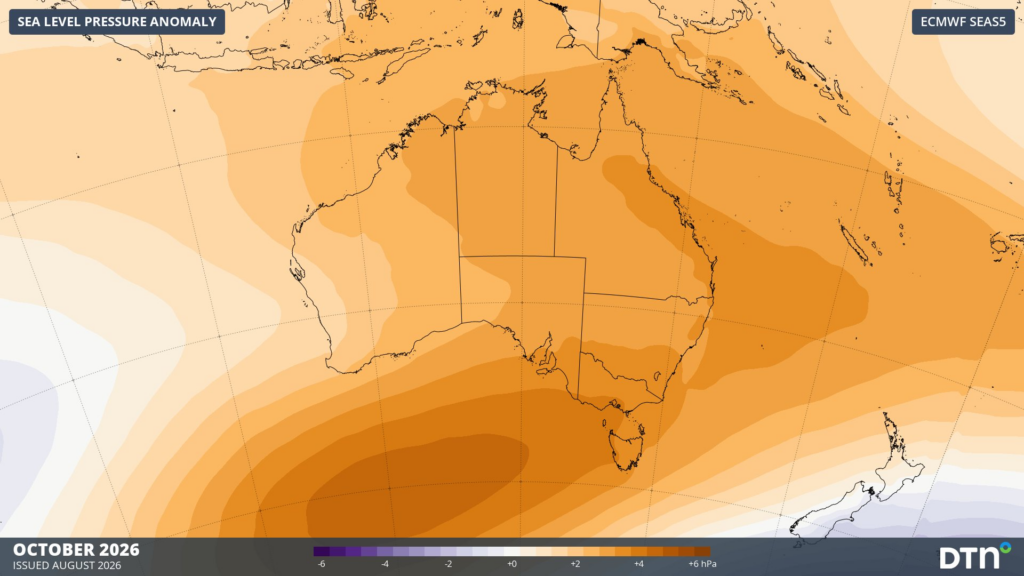
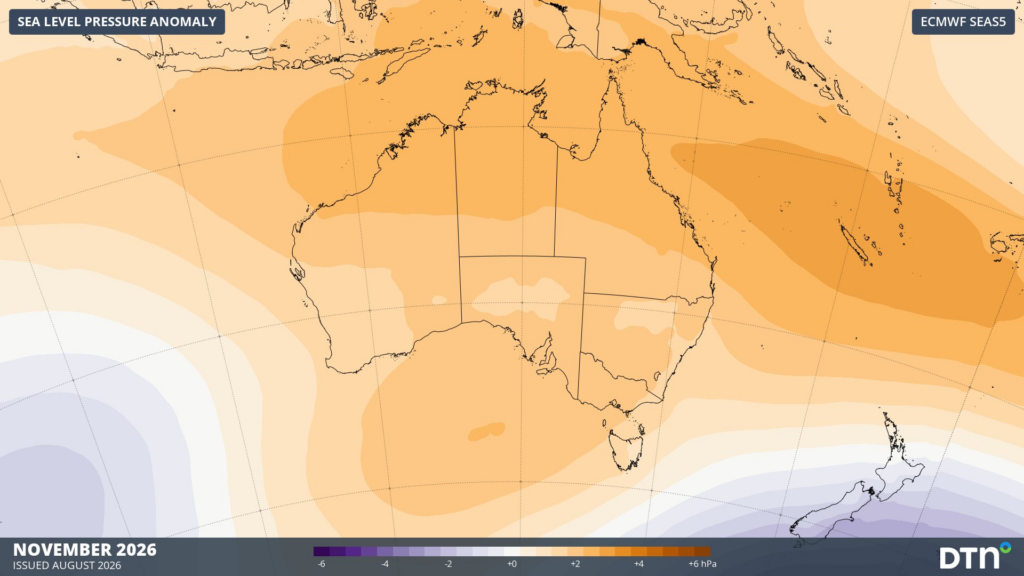
Images: September (top), October, November MSLP forecast maps. Source: DTN
Heatwave risk
The patterns in the maps above can be a sign of heatwave risk, with high pressure systems blocking cold fronts or cooler airmasses from sweeping across the south of the country.
The type of heatwave associated with a positive SAM / high pressure spring differs meaningfully from the heatwaves typical of La Niña years. La Niña heatwaves tend to be shorter, lower-intensity events, often broken up by the more active frontal and trough activity that comes with a more northerly storm track. Positive SAM / highpressure heatwaves, by contrast, are driven by persistent, blocking-style ridging that can sit in place for extended periods with little disruption from passing systems, allowing heat to build day over day rather than being flushed out by a front. That raises the risk of longer-duration, higher-intensity heat events.
For the NEM, that combination-persistent high pressure, light winds, and the potential for sustained rather than short-lived heat is the scenario worth planning around.
The impact on the energy market
The same high pressure, light-wind pattern behind the heatwave risk also shapes the supply side:
- Light winds reduce wind generation output across the NEM’s wind fleet, right in the period when high pressure and clear skies are most persistent.
- Clear, settled conditions under that same ridging typically boost solar output through the middle of the day, although unusually warm seas surrounding Australia may produce more cloud and rain than during a typical El Niño.
- Sustained heat, especially during blocking-pattern heatwaves, pushes demand up sharply in the evening as temperatures peak and solar output tails off into the net-demand ramp.
The net effect is a spring where midday solar generation may be strong, but the market faces a wind generation shortfall exactly when extended heat events are most likely to push demand higher tightening the evening ramp period in particular.
Uncertainty: the vortex can flip
A stable vortex through winter is a genuinely useful lead indicator, but it isn’t a guarantee and this risk has become more relevant in recent years, not less.
What is a sudden stratospheric warming?
It’s exactly what it sounds like: a rapid, dramatic spike in temperature high in the stratosphere above Antarctica – often 20–30°C in a matter of days caused by large-scale atmospheric waves from the troposphere disrupting the polar vortex.
That warming decelerates or can even reverse the westerly winds that normally hold the vortex together, effectively breaking down the tight, contracted wind pattern associated with a stable, positive-SAM vortex.
The map below shows the potential vorticity or how air masses were spinning on August 5, 2024 during a Sudden Stratospheric warming event in the southern hemisphere. The polar vortex was elongated and weak over Antartica, and the flow was shaped like a peanut instead of a ball.
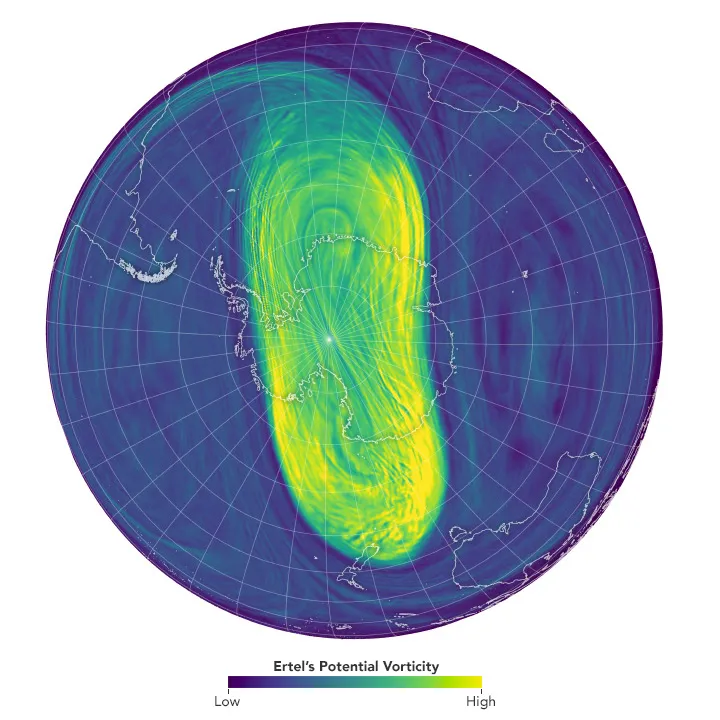
Image: Potential vorticity on August 05, 2024. Source: NASA
Historically, major Southern Hemisphere sudden stratospheric warmings (SSWs) were considered rare with only two majors on record, in 2002 and 2019, roughly 17 years apart. But the pattern has shifted recently:
- 2019 – a rapid vortex collapse in late August–September drove Antarctic stratospheric temperatures to record levels and pushed SAM sharply negative, contributing directly to the hot, dry conditions behind the 2019/20 Black Summer fires.
- 2024 – two separate stratospheric warming events hit in quick succession (mid-July and early August), one of the earliest-season SSWs on record, each triggering a downward-propagating negative SAM signal.
- 2025 – another late-winter/early-spring SSW developed through September, again pushing SAM negative and disrupting the seasonal outlook at the time.
So rather than a once-in-a-generation event, the last few years have shown these disruptions occurring far more frequently than the historical baseline highlighting the fact that the vortex and stratospheric temperature need to be monitored.
What this means for energy businesses in Australia
If you’re a wind generator, lighter than usual winds are forecast this season and unfortunately the lightest wind periods could align with peak demand.
If you’re running solar, there’s some good news: clearer days under that high pressure (apart from the east coast) should help midday output. Although warmer than usual Indian Ocean waters could increase the tropical moisture feed throughout central Australia down to the southeast, which could at times bring northwest cloudbands.
For retailers and traders, the evening is where the real risk sits -solar drops away right as demand peaks, with less wind to lean on. And because this kind of heatwave tends
However, If the polar vortex gets disrupted, conditions could swing back toward a more normal, windier spring quickly and without much warning. This is something DTN APAC will continue to monitor and update clients in the coming season.
Learn more about our weather solutions for the Energy sector
A warm start to spring
A burst of warm air will sweep over NSW in the opening days of September, possibly giving Sydney its warmest start to spring in more than 50 years.
This weather pattern is not unusual for spring. However, its timing could see some areas in NSW having their warmest start to spring in decades.
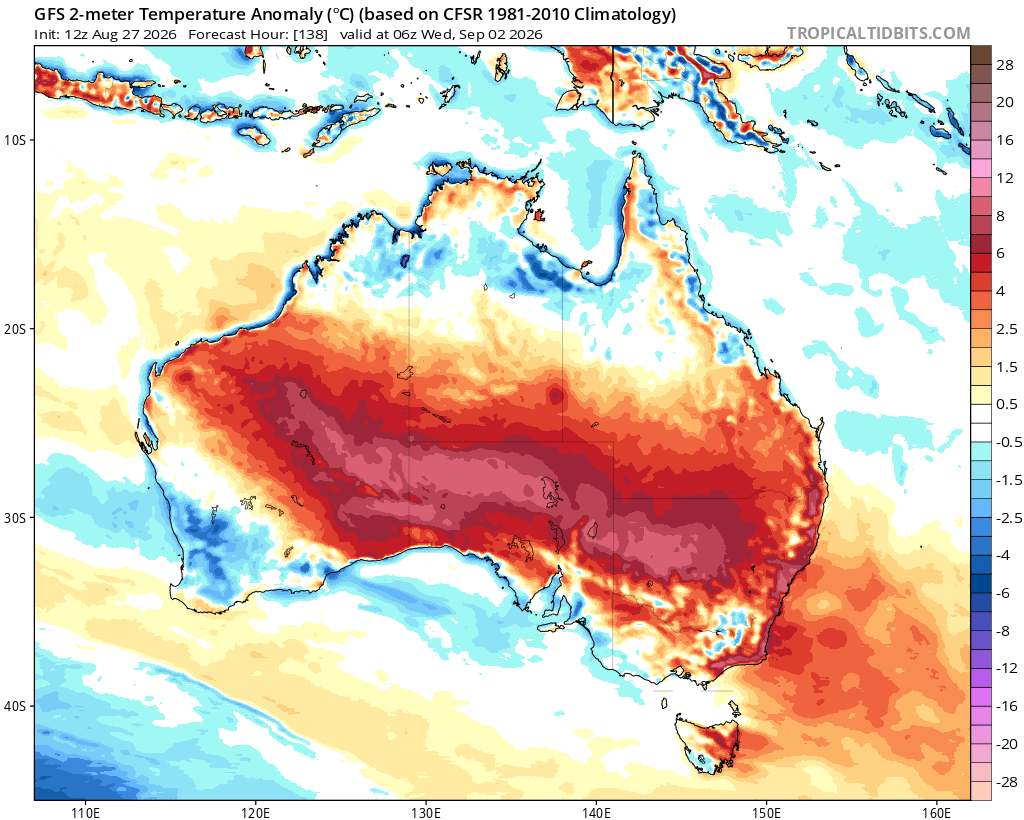
Image: Modelled temperature anomalies on the afternoon of Wednesday, Se
Sydney is currently forecast to reach 24–27°C between Tuesday and Thursday next week, which are the first three days of spring. This is around 4–7°C above average for this time of year.
The last time Sydney reached at least 24°C on the first three days of spring was in 1969. If the city’s temperature manages to climb above 24.8°C between Tuesday and Thursday next week, which is possible, it will be the city’s warmest start to spring in 161 years.
Other areas in eastern and southeastern Australia will also get a taste of the early-season warmth next week.
Maximum temperatures in Melbourne and Adelaide are forecast to reach around 21–22°C next Tuesday, while Hobart should reach about 19°C. These temperatures are about 3–4°C above average for a September day.
Forecasts for the remainder of spring suggest this warm streak will continue to impact the NEM.




