
In mid-May 2026, DTN APAC meteorologists flagged a strengthening Southern Ocean pattern in model guidance, signalling an extended run of record-challenging wind conditions across the NEM.
Nearly three weeks later, NEM wind generation climbed from around 1.5GW to more than 9GW, supplying roughly one-third of the grid and coming within 1GW of the all-time generation record.
The event highlighted how key market signals can emerge in atmospheric patterns weeks before they are reflected in operational and market data
The forecast signal emerged in mid-May 2026
In mid-May 2026, DTN APAC meteorologists forecasted a deep long-wave trough in forecast guidance for late May–early June period, signalling an extended period of strong wind conditions across the National Electricity Market (NEM).
The chart below shows ECMWF ensemble guidance presented to clients at the time, with the blue anomalies extending northward from Antarctica towards Australia indicating the long-wave trough and associated Southern Ocean pattern. This setup supported our forecast for a very windy period across the NEM, despite a typically wind-suppressive positive Southern Annular Mode (SAM).
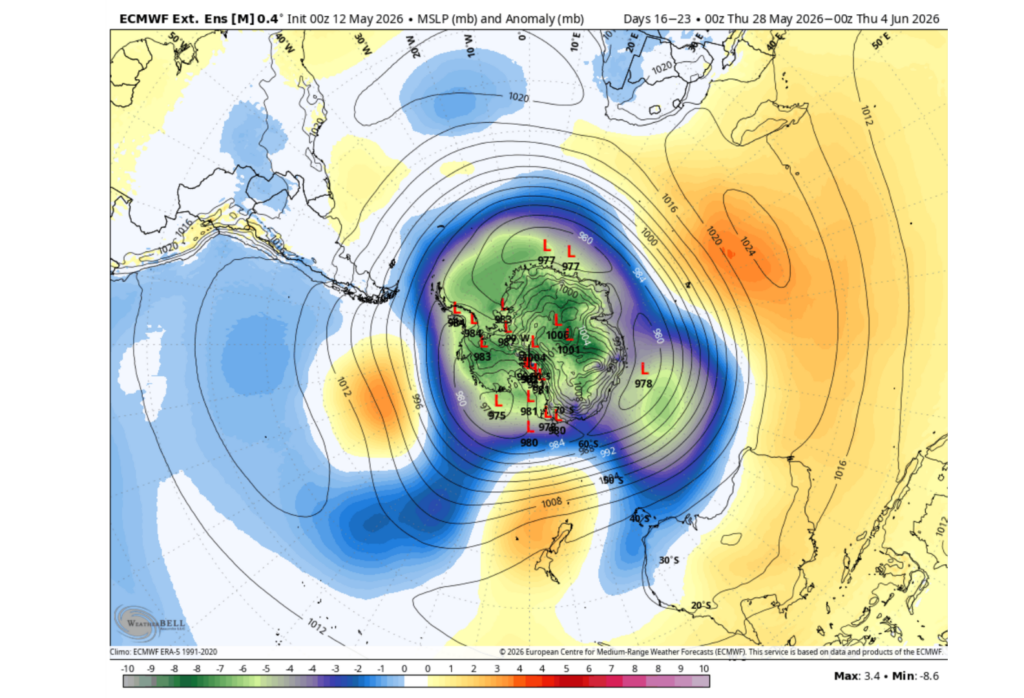
Image: ECMWF Extended Ensemble MSLP and anomaly, initialised May 12, 2026, for the period of Thursday, May 28 to Thursday June 04, 2026. Source: WeatherBell/ECMWF.
From atmospheric signal to market outcome
Over the final days of May and into early June, successive fronts and deep low pressure systems crossed southern Australia, delivering sustained periods of strong winds and widespread rainfall across much of the NEM. Wind generation climbed steadily through the period before reaching its highest levels midway through the first week of winter.
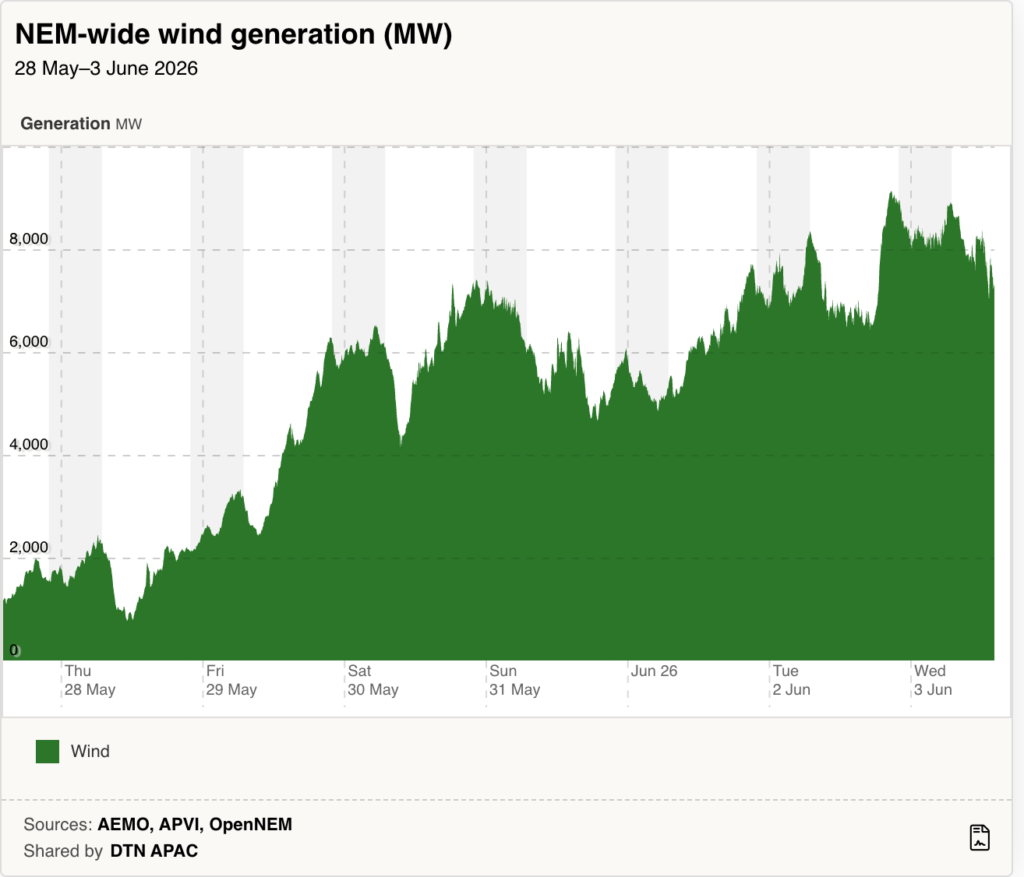
Image: NEM-wide wind generation (MW) between May 28 and June 3, 2026. Source: OpenElectricity.
The graph above highlights that the output remained above 7GW for more than a day and a half and above 8GW for extended periods, underscoring the persistence of the atmospheric setup as opposed to than a brief weather-driven spike.
Wind generation peaked at 9,135MW at 9:45pm AEST on Tuesday, June 2, which fell just 1024MW short of the all-time record that was set on July 25, 2025. Over the course of that day, wind accounted for 25-35% of total NEM generation, up from just 7% when the week began.
Over the full six-day period from Wednesday 28 May to Monday 2 June, the NEM’s wind fleet generated 748 GWh in total, averaging 124.7 GWh per day — well above the annual daily average of 100 GWh. To put that in longer-term context, in June 2014, the entire month’s wind generation across the NEM was 837 GWh. This week alone, just six days delivered 748 GWh.
The grid began feeling the pressure
Wind output also began to test the limits of the grid on Tuesday, June 2, 2026. As wind generation increased, so did curtailment.
Curtailment: The reduction of wind or solar generation below what turbines could physically produce, typically due to transmission congestion, system security requirements, or network limitations.
Across the event, the atmosphere was capable of producing hundreds of megawatts more energy than the grid could fully utilise. At Tuesday’s peak, around 588MW was curtailed, implying potential output closer to 9,720MW at that moment.
Impacts beyond energy
The atmospheric setup was also evident beyond the electricity market, with the same sequence of fronts and low-pressure systems driving severe weather across southern and eastern Australia.
Damaging winds affected South Australia, Victoria, New South Wales and the ACT, while widespread rainfall benefited many winter cropping regions.
A deep complex low centred over the eastern Great Australian Bight generated widespread severe weather warnings across SA, VIC, NSW and the ACT. Thredbo Top Station recorded a gust of 133 km/h, with damaging winds exceeding 100 km/h across parts of the Flinders Ranges, alpine Victoria, and the Snowy Mountains, as covered by Weatherzone.
For sectors including agriculture, mining, logistics and ports, the event reinforced how the same large-scale climate drivers can influence operational conditions across multiple industries simultaneously.
And it’s still going — Wednesday June 3
As this article was being written on Wednesday, June 3, the pattern showed no sign of abrupt collapse. NEM-wide wind generation averaged 8,266MW across the first half of Wednesday June 3, a level that was only briefly touched on Tuesday at the evening peak. Where Tuesday’s peak saw 588MW being curtailed at the moment of maximum output, Wednesday morning averaged 897MW of curtailment across every interval, with multiple spikes above 1,000MW.
Strong westerly winds will prevail across southeastern Australia on Thursday and Friday, with another sharp frontal passage expected on Friday before winds ease on the weekend.
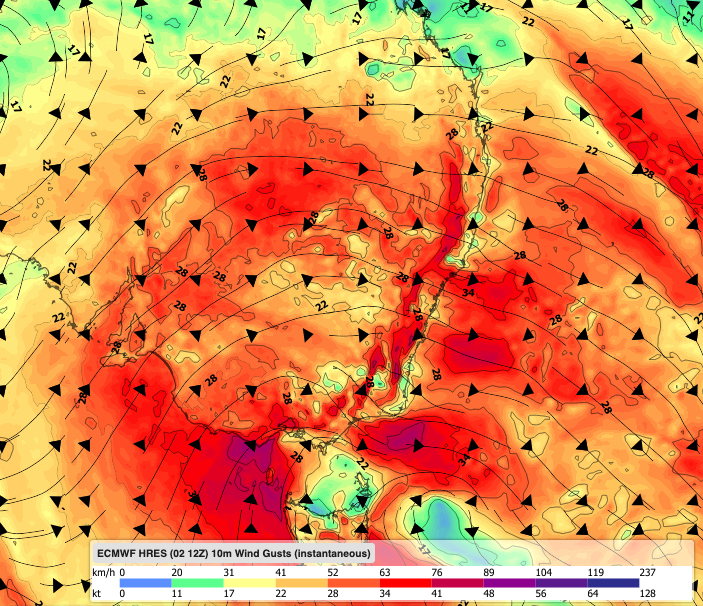
Image: ECMWF HRES 10m wind gust forecast for 1pm on Thursday June 4, 2026.
Early next week, a strengthening high to the northwest looks to squeeze frontal activity further south — tracking systems closer to the Southern Ocean rather than across the main NEM wind farm footprint, although winds should increase again from Tuesday June 9, particularly for southern Australia.
The pattern remains active
The broader pattern shows little sign of disappearing immediately. The longwave trough and positive SAM setup looks to remain firmly in place through at least mid-June, keeping the active frontal pattern going and winds elevated across southern Australia.
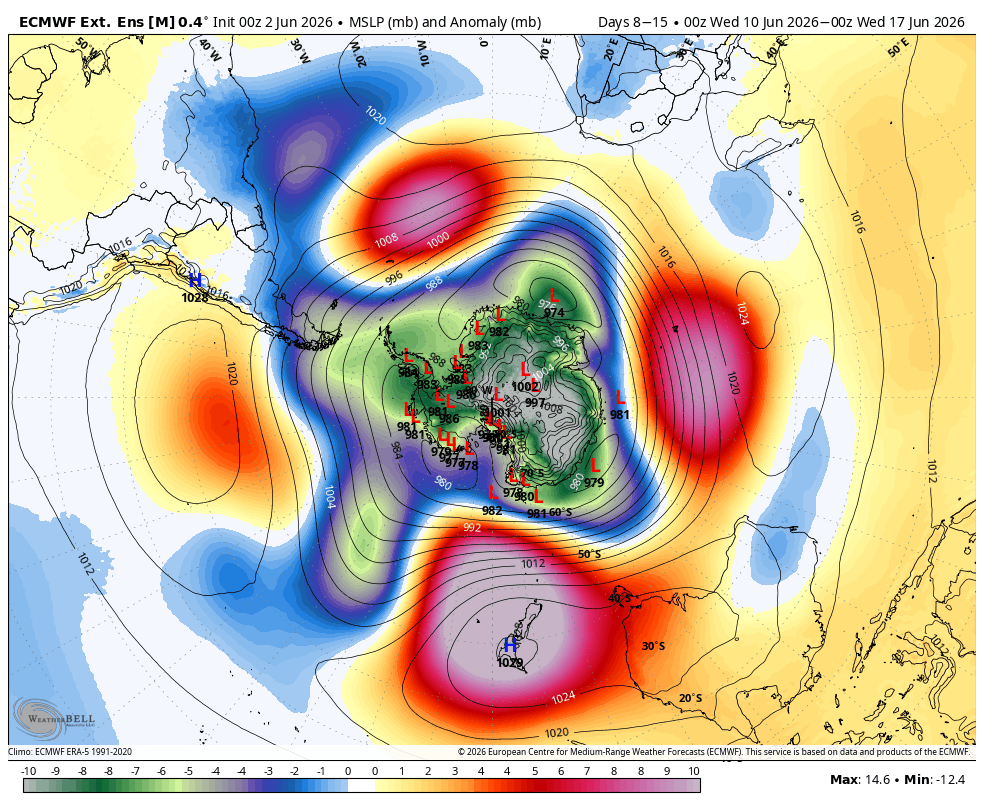
ECMWF Extended Ensemble MSLP and anomaly, initialised June 2, 2026, for the period of Wednesday, June 10 to Wednesday, June 17, 2026. Source: WeatherBell/ECMWF.
From mid to late June the ensemble guidance suggests the trough begins to retract, pointing to a gradual easing of the active westerly regime heading into that period.
How DTN APAC can help
As renewable penetration continues to grow, understanding large-scale climate drivers such as the Southern Annular Mode, Rossby wave patterns and longwave trough positioning becomes increasingly valuable.
These signals shape generation, pricing, curtailment risk and operational conditions long before they appear in market data.
This event was a reminder that weather remains one of the most important drivers of Australia’s energy system and that some of the most valuable insights come from recognising the signal before the market feels the impact.
To learn more about how DTN APAC’s meteorologists help businesses anticipate and manage weather risk across energy, mining, ports and critical operations, visit our risk communicators page on our website.




