There are signs that a very strong, or ‘super’ El Niño could develop in the tropical Pacific Ocean later this year. So, what does this mean for Australia’s weather during the second half of 2026?
El Niño on the horizon
The tropical Pacific Ocean is currently in a neutral state, meaning neither El Niño nor La Niña are occurring. However, there are strong indications that El Niño will emerge as we head into the Southern Hemisphere’s winter.
The first indicator of the looming El Niño is a large pool of abnormally warm water sitting beneath the surface of the tropical Pacific Ocean.
El Niño occurs when sea surface temperatures in the central equatorial Pacific Ocean – an area called the Niño 3.4 region – become warmer than average. The Bureau of Meteorology’s threshold for El Niño is at or above 0.8°C warmer than average in the Niño 3.4 region, while some other countries, including the United States, use a lower threshold of 0.5°C above average.
While ocean surface temperatures in the Niño 3.4 region are currently near average for this time of year, there is a large slab of unusually warm water sitting around 50 to 250 metres below the surface. These above-average sub-surface temperatures have strengthened in the last couple of months, with anomalies exceeding 6°C in some areas. It’s possible that these warm sub-surface waters will upwell towards the surface in the coming weeks and months, which could kick off El Niño.
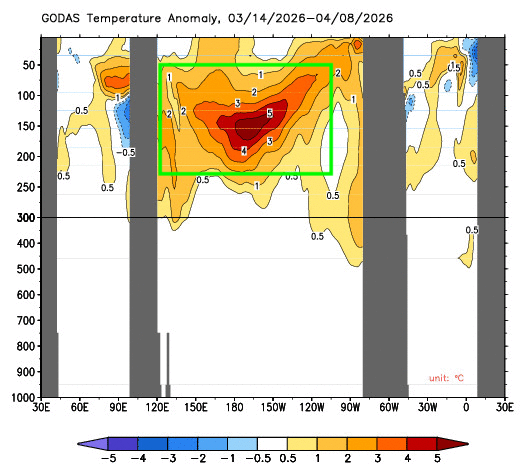
Image: Sub-surface temperature anomalies in the equatorial Pacific Ocean from early March to early April, 2026. The red shading inside the green box shows abnormally warm water lying beneath the surface of the tropical Pacific Ocean. Source: Bureau of Meteorology.
A second sign that El Niño is about to emerge is overwhelming agreement between global forecast models.
At this time of year, we typically see a lot of uncertainty in forecasts for El Niño and La Niña due to a phenomenon called the autumn predictability barrier in the Southern Hemisphere (spring predictability barrier in the Northern Hemisphere). However, there is strong model consensus that El Niño will develop in the next few months.
Some models also predict that the imminent El Niño will become a very strong event – what is sometimes referred to as a ‘super El Niño’ – meaning sea surface temperatures in the Niño 3.4 region will reach 2.0°C above average or higher. According to the National Oceanic and Atmospheric Administration Climate Prediction Centre’s latest forecast, there is roughly a 25% chance of a very strong El Niño occurring towards the end of this year.
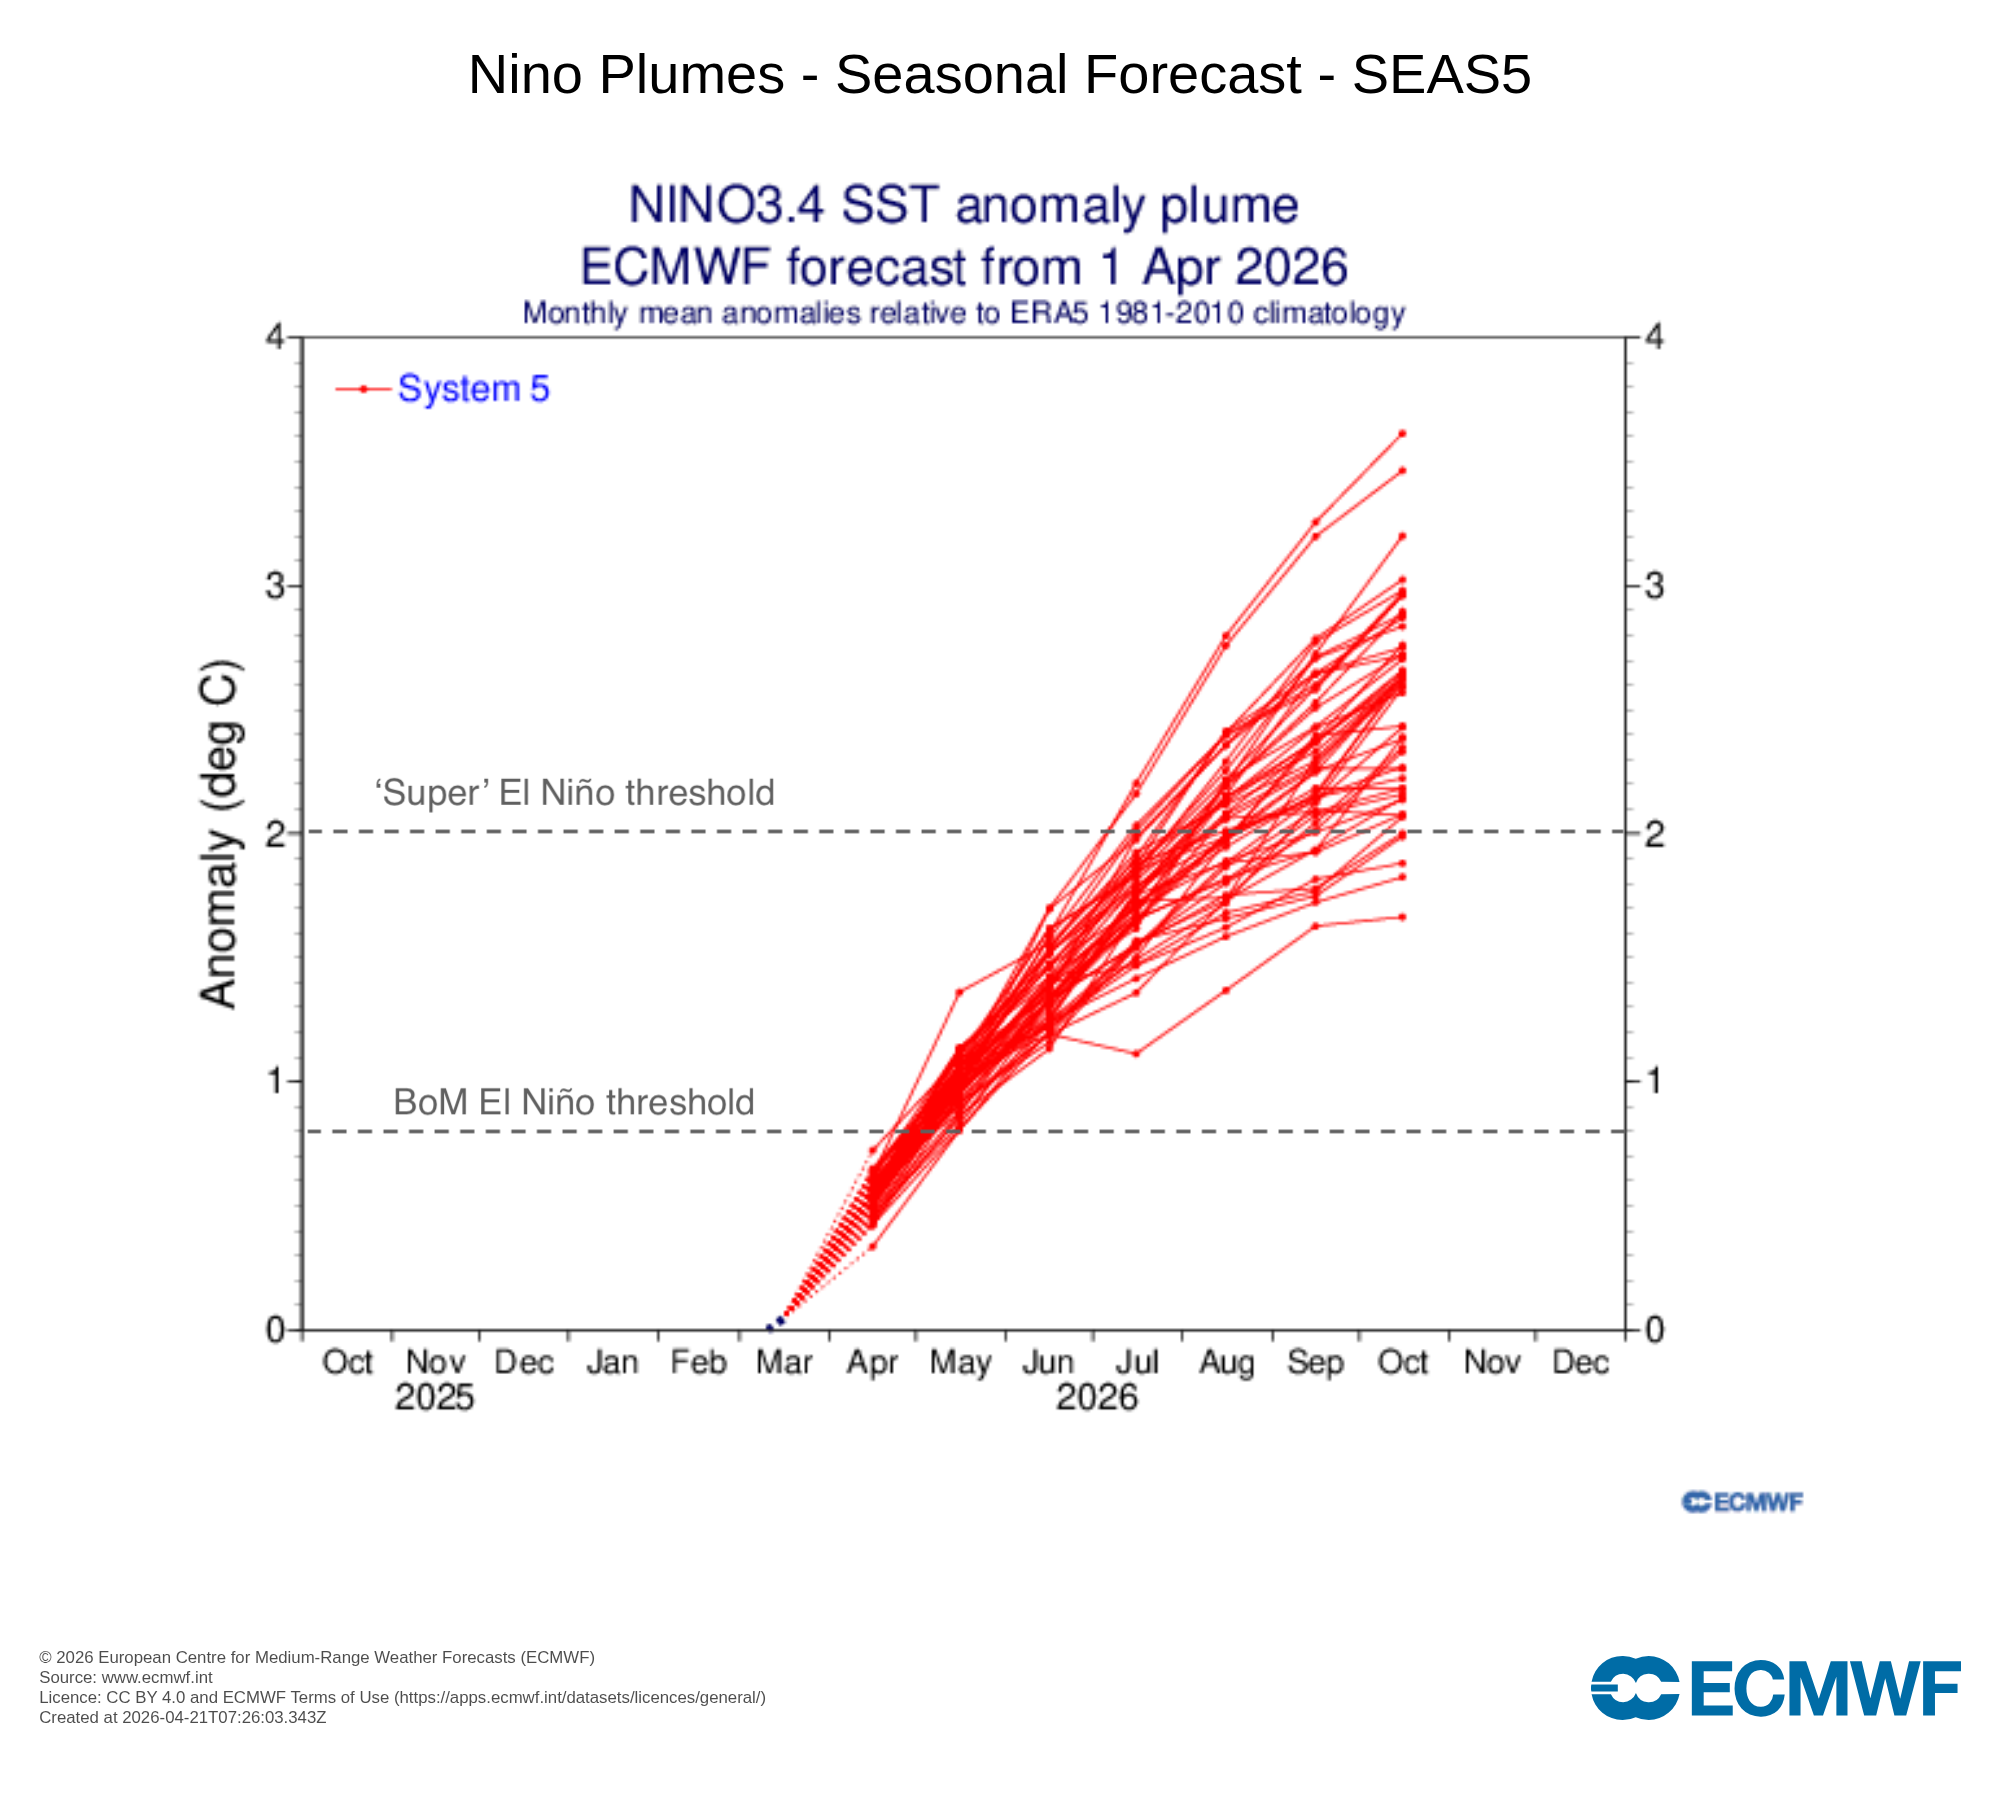
Image: El Niño forecast plume from the ECMWF SEAS5 model. Each red line represents a forecast from one of 51 different ensemble members from the same model. Each member uses slightly different initial ocean conditions as the basis for its forecast, which helps account for a range of possible scenarios in the forecast. Note that all ensemble members from this model are predicting El Niño conditions from May and most are suggesting a very strong, or ‘super’ El Niño later in the year. Source: ECMWF (annotated by Weatherzone).
What does El Niño mean for Australia?
El Niño does not guarantee any kind of weather for Australia. However, it does make some types of weather more likely than others, particularly during winter and spring.
The maps below show the observed changes to rainfall and maximum temperature from past El Niño events. These maps show conditions averaged out across multiple 9 or 10 El Niño years, representing the general impact of El Niño on daytime temperatures and rainfall.
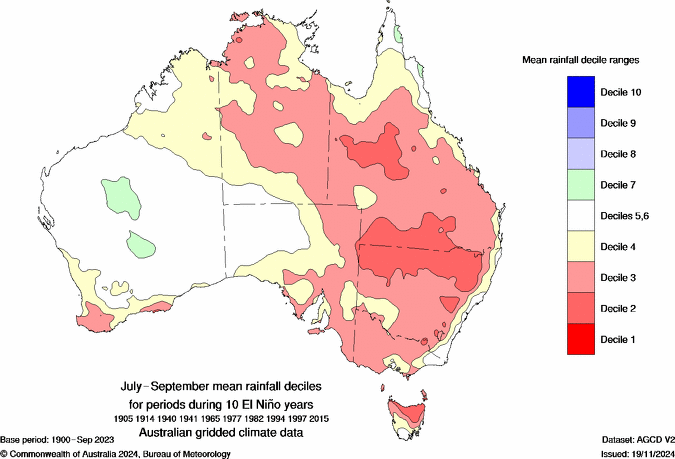
Image: Observed rainfall deciles for the July to September period during 10 El Niño events from 1905 to 2015. The red shading shows where rainfall is below average. Source: Bureau of Meteorology.
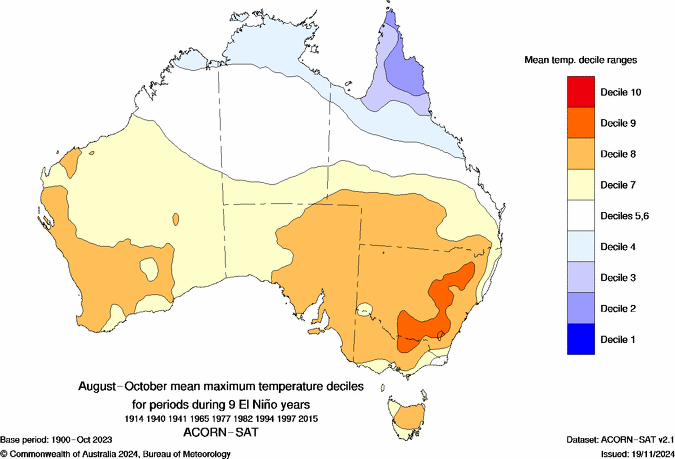
Image: Observed maximum deciles for the August to October period during nine El Niño events from 1914 to 2015. The orange and yellow shading shows where maximum temperatures are above average while blue is below average. Source: Bureau of Meteorology.
In general, El Niño typically causes:
- Below average rainfall over large areas of Australia during winter and spring. However, its influence on rainfall is usually weaker in summer and autumn.
- Above average maximum temperatures for most areas outside the tropics, particularly during the second half of the year. In the tropics, El Niño typically reduces maximum temperatures in the dry season and makes days warmer in the wet season.
- Enhanced evaporation due to above average temperatures and below average rain, which can cause of enhance drought.
- More intense daily heat extremes in southern Australia, but with a reduced frequency of prolonged heatwaves.
- Increased frost risk in winter and spring due to enhanced radiative cooling with clearer skies.
- Increased risk of dangerous fire days in southeastern Australia as temperatures rise in spring and summer.
- Decreased seasonal peak alpine snow depths and a shorter snow season.
The strength of El Niño can also affect how it influences Australia’s weather. Stronger El Niño events make it more likely that the impacts mentioned above will occur. However, it is important to point out that stronger events do not always mean bigger weather impacts and even a weak El Niño can cause significant weather and climate impacts in Australia. It’s also worth noting that no two El Niño events are the same and other external influences, such as regional ocean temperatures near Australia, and other climate drivers, such as the Indian Ocean Dipole (IOD), will likely affect how El Niño impacts Australia in the coming months.
DTN APAC helps businesses navigate climate volatility by providing high-precision, actionable weather intelligence, forecasting and risk management tools. We offer tailored solutions to protect assets, ensure worker safety, and optimise operations for industries like energy, mining, and transport, reducing financial losses from severe weather.


