We have crunched the numbers and yes, summer was very humid across much of southeastern Australia.
Many cities in the National Electricity Market (NEM) recorded dewpoints 3 to 5°C above average this summer, with Sydney recording its highest hourly dewpoint on record on Thursday, January 11 of 25.9°C.
But firstly, what is the dewpoint?
Meteorologists monitor atmospheric moisture by measuring the dew point, which is the temperature the air must cool to for condensation to occur. The more moisture in the air, the higher the dew point and the harder it becomes for our bodies to cool by sweating.
For example, this is how different dew point temperatures would make you feel if you were accustomed to Australia’s sub-tropical climate:
- >24°C – Oppressive, uncomfortable for most, possible heat stress issues
- 20-24°C – Muggy and quite uncomfortable
- 15-20°C – Starting to feel muggy, though still comfortable for most
- 10-15°C – Comfortable 5-10ºC – Dry
- < 5°C – Very dry
The map below shows that much of the NEM saw higher dewpoints around 2°C above average this summer, with isolated areas 5°C above average in Qld.
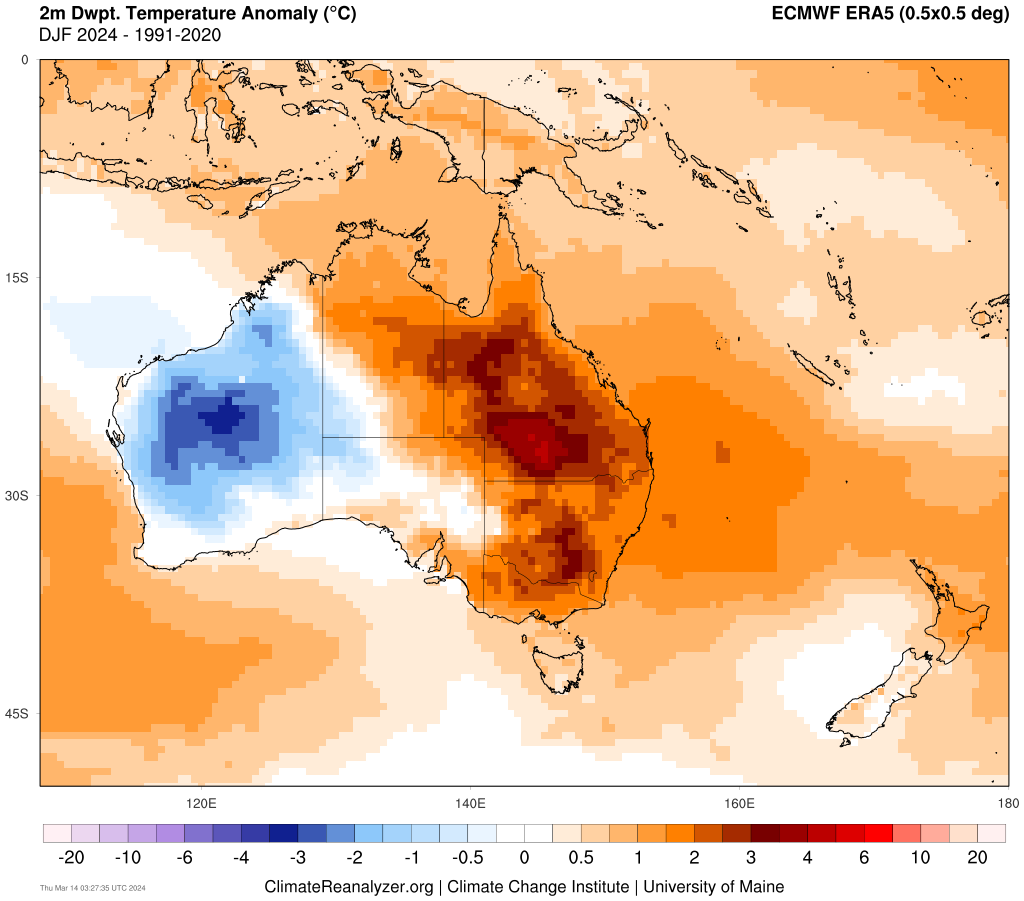
Image: 2m Dewpoint anomaly for Summer 23/24 compared to the 1991-2020 average, source: climatereanalyzer.org
The image above shows the huge contrast in the humidity across Australia, with parts of WA recording dewpoints 3°C below average.
The average summer 3pm dewpoint for the capitals compared to the summer average (data up to 2010):
- Canberra’s dewpoint was 5°C above average this summer, recording an average 3pm dewpoint of 13.7°C
- Sydney’s dewpoint this summer was 19.9°C, 3°C higher than average.
- Brisbane’s dewpoint was about 2°C above average, with an average dewpoint of 20.9°C
- Melbourne’s average dewpoint was 13.3°C, nearly 3°C above average
- Adelaide’s dewpoint was around 2°C above average, with an average summer dewpoint of 11.6°C
- Hobart’s dewpoint was about average for summer with a dewpoint of 8.8°C
Sydney and Brisbane’s humid weather has unfortunately combined with warm days and nights, adding to the discomfort, and bringing many days of rain and thunderstorms to the states.
The map below shows that much of NSW, Tas and parts of SA, Qld and the ACT saw warmer-than-average temperatures this summer.
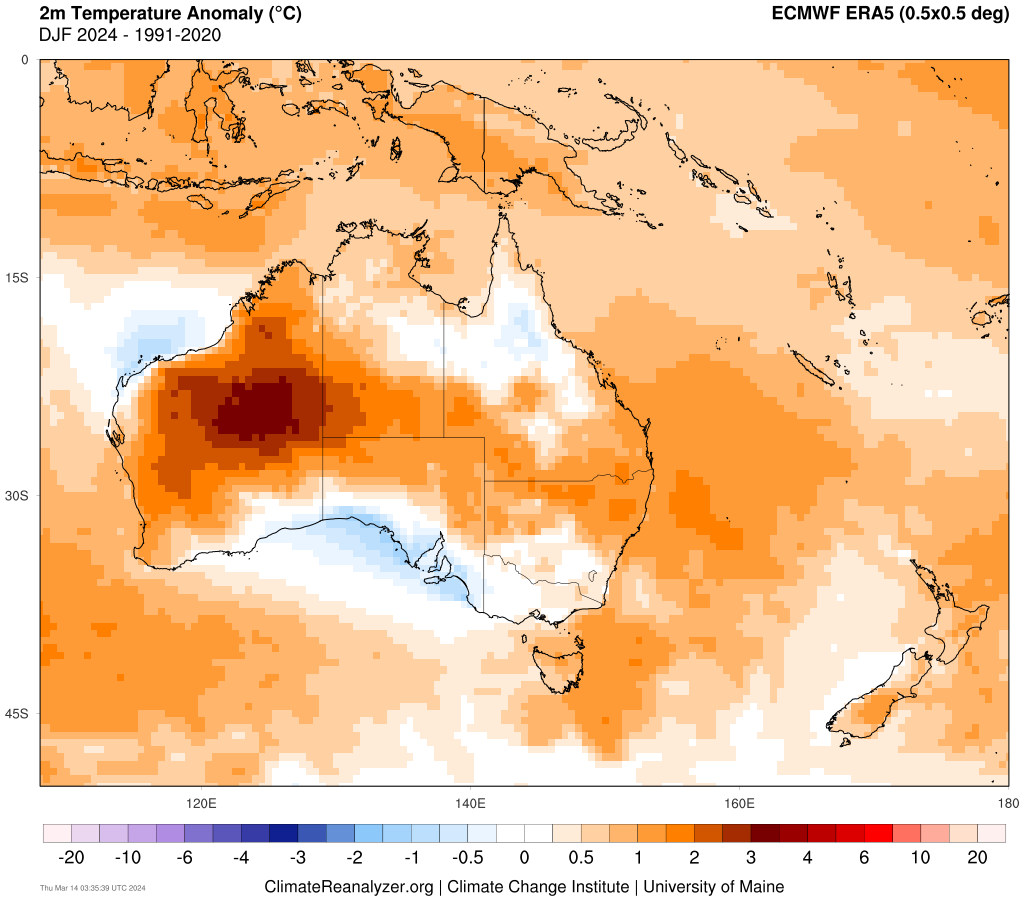
Image: 2m temperature anomaly for Summer 23/24 compared to the 1991-2020 average, source: climatereanalyzer.org
Brisbane also sweated through oppressive heat this summer with abnormally warm temperatures and atmospheric moisture impacting the city.
Impressively, Brisbane failed to drop below 20ºC during the first two and a half months of 2024. This run of 74 days with temperatures above 20C finally broke on Friday morning, March 15, with the minimum temperature dropping to 19.8C. This 74 day run breaks the previous record of 59 days above 20ºC from 1978.
Why so humid?
Prevailing easterly winds coming off an unusually warm Tasman and Coral Sea have been transporting moisture laden air into eastern Australia, sometimes making it all the way to the southern states.
The map below shows the warmer oceans surrounding much of Australia, particularly the east.
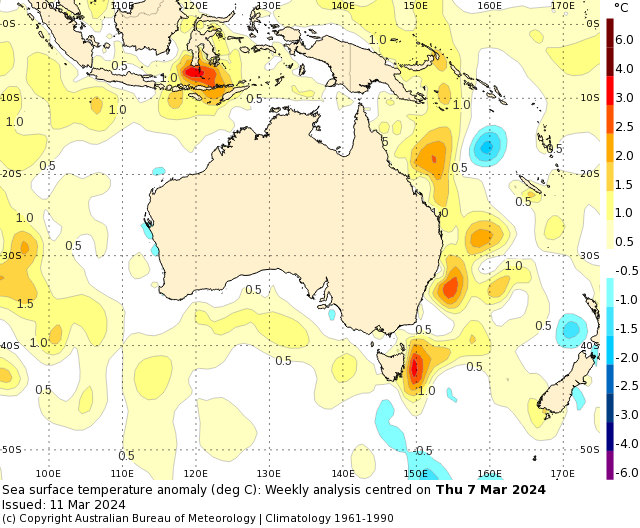
A tongue of warm water off the NSW, has set new records in the western Tasman Sea in recent weeks and is theoretically warm enough to support a tropical cyclone near Sydney.
The map below shows the sea surface temperatures off the NSW coast have been running around 2 to 3°C above average in recent weeks, with some areas more than 3°C warmer than usual for this time of year.
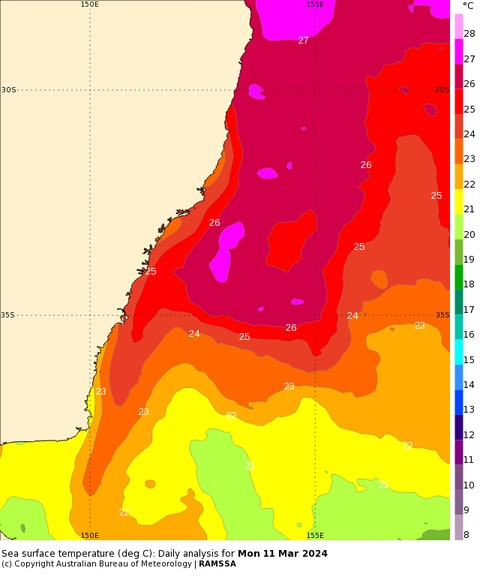
Image: Daily analysis of sea surface temperature for Monday, March 11. Source: Bureau of Meteorology
Looking ahead, these ‘bath-like’ seas should continue to the atmosphere humid in the east in the next few months or so. For more information on our energy forecasts, please contact us at apac.sales@dtn.com.