
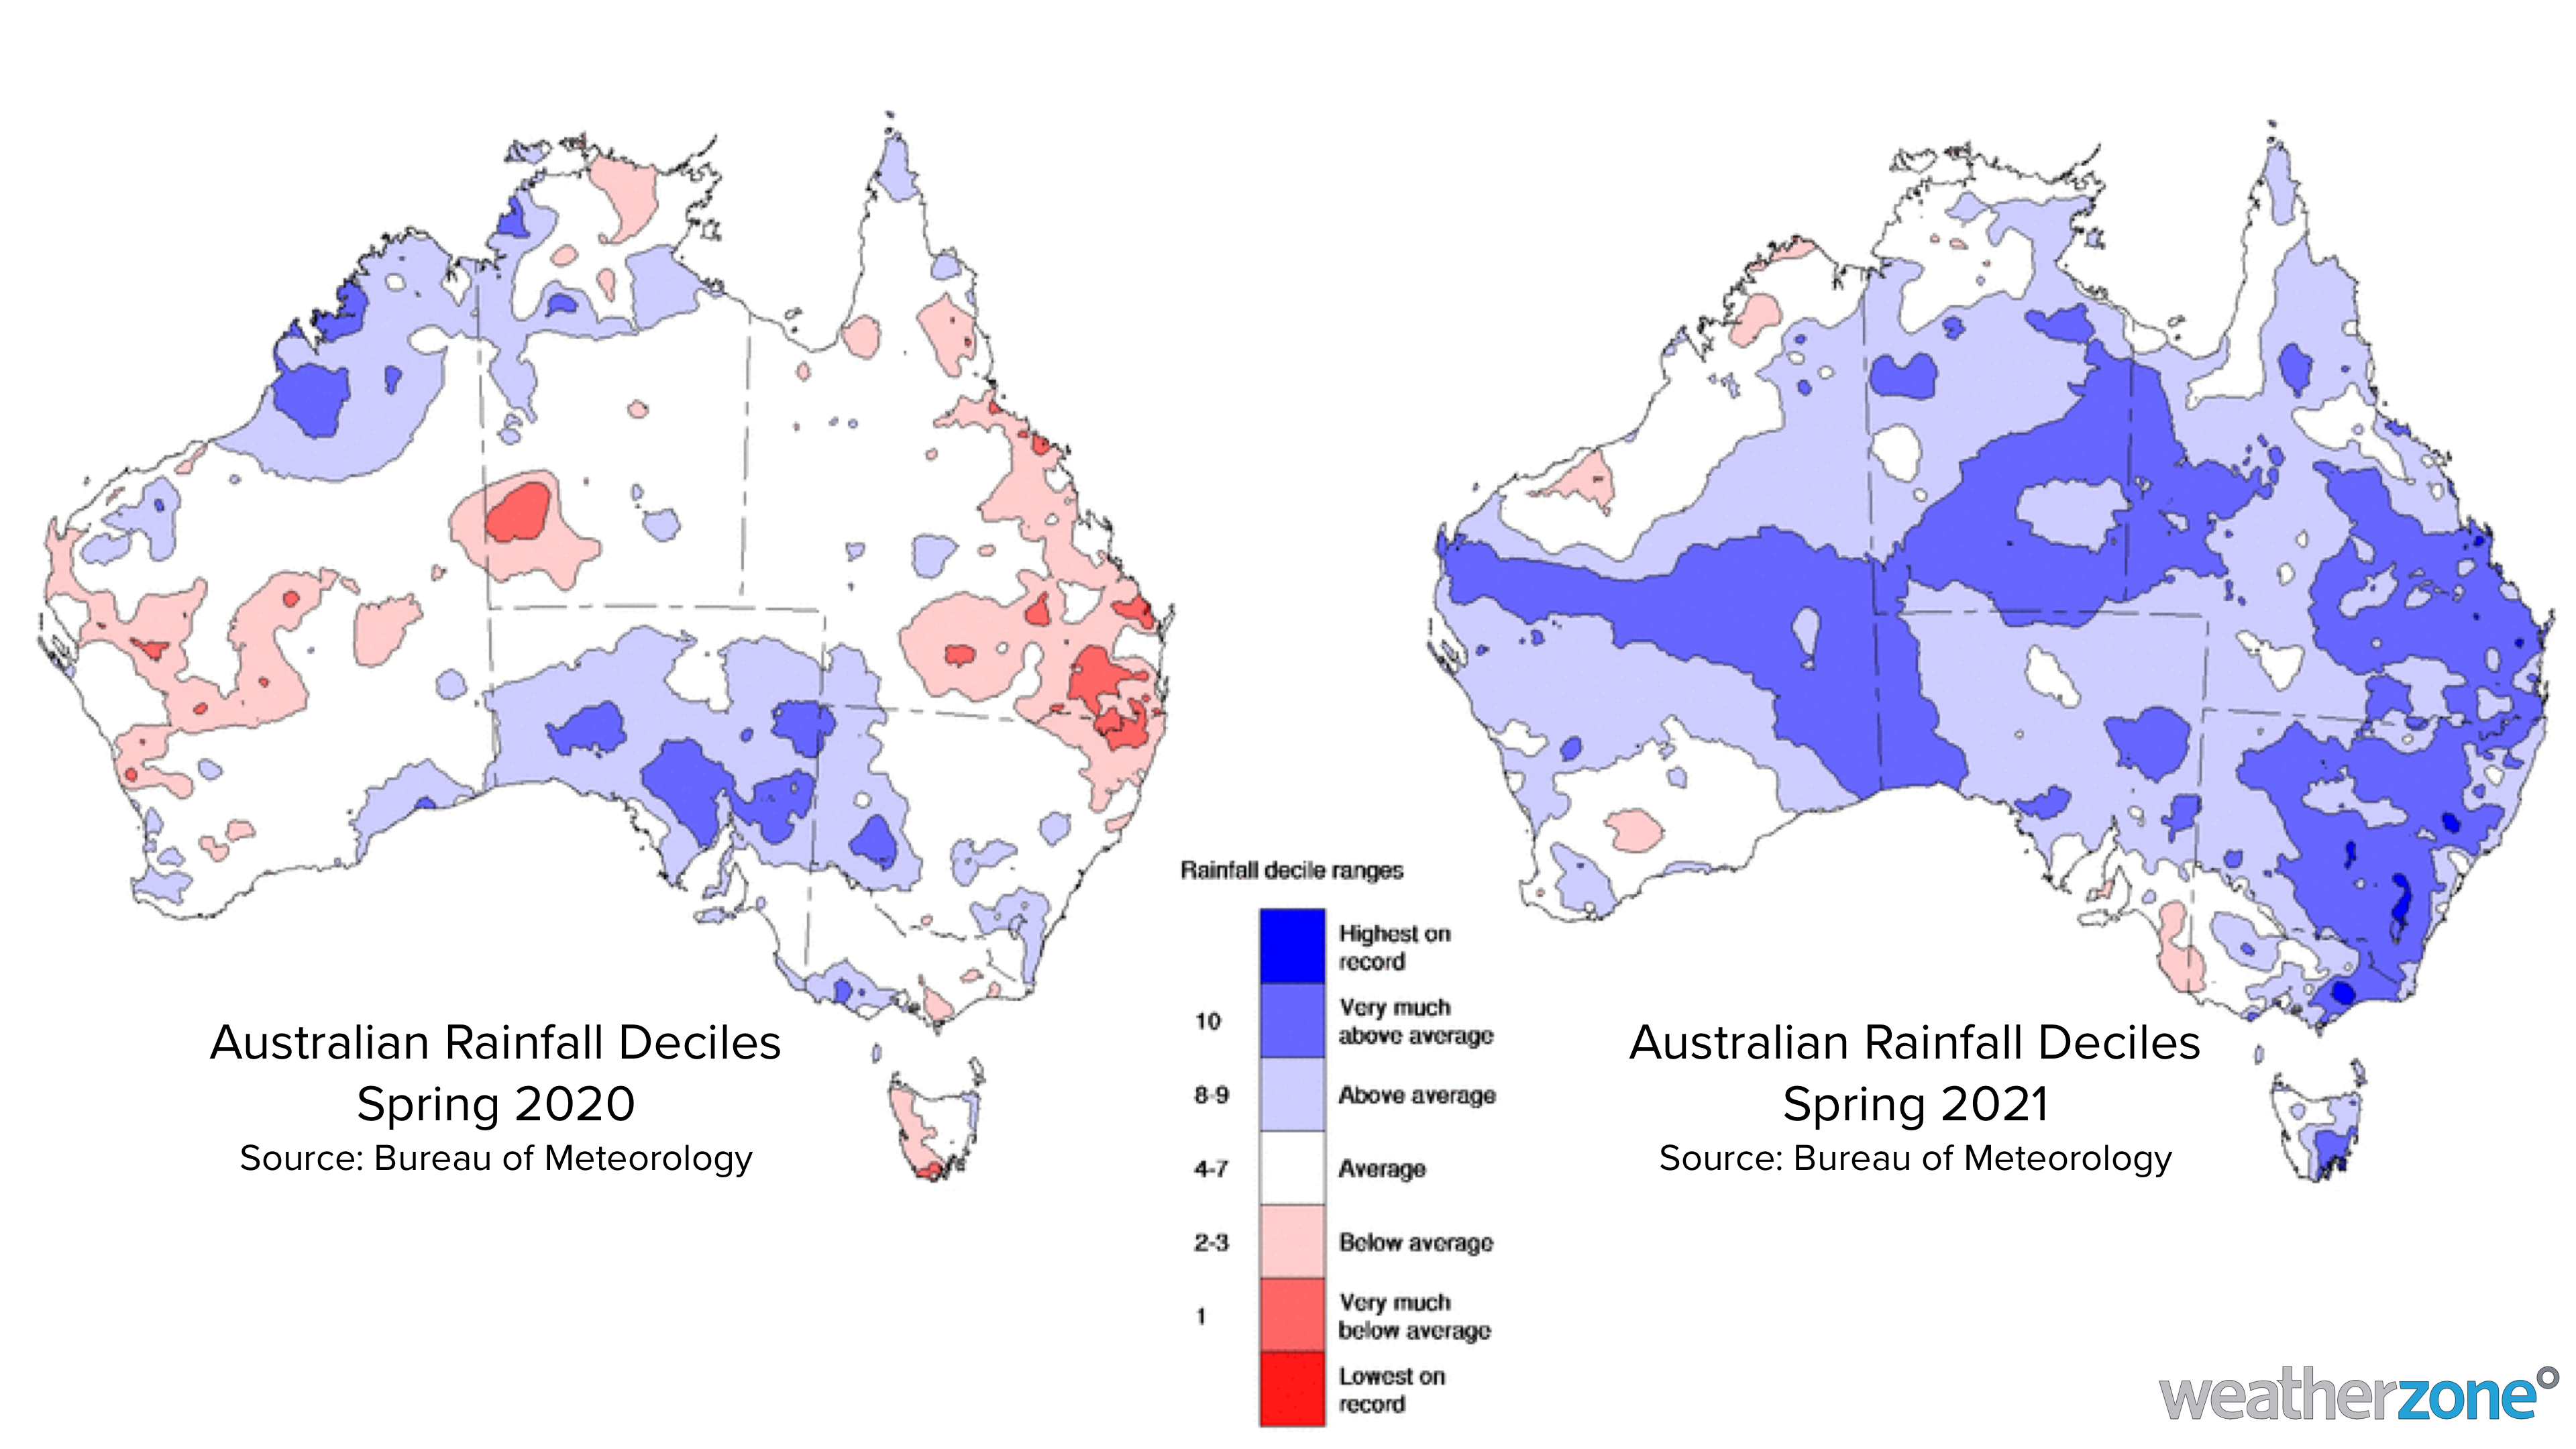
La Niña just helped Australia register its wettest November on record and wettest spring in 11 years. So, why was this La Niña so much wetter than last year’s La Niña?
Going back-to-back
La Niña was officially declared during the last week of November 2021, making this the second consecutive La Niña year in a row. This is the first time we have seen back-to-back La Niña events in a decade.
Back in 2020, La Niña was officially declared in September, a few months earlier than this year’s event. As a result, above average spring rainfall was forecast across central and eastern Australia last year.
As La Nina is the most predictable climate driver of Australian rainfall, this forecast seemed reliable. However, parts of Australia saw very much below average rainfall towards the end of 2020, particularly in November.
By contrast, most of Australia just saw above-average rain during spring and many areas experienced their wettest November on record.
The maps below show Australia’s rainfall deciles for November and spring during the last two years.


So why was last year’s La Niña so dry and this year’s so wet?
It’s important to note that while La Niña increases the likelihood of above average rainfall, it doesn’t guarantee a wetter than average season. It can be counteracted by other climate drivers and as a result, the impacts of every La Niña event are different.
There are several reasons why we saw drier than average conditions during spring 2020.
Firstly, the oceans near northern Australia were not as warm as anticipated, which reduced the amount of moisture across the continent.
A negative phase of the Indian Ocean Dipole (IOD), which typically brings warmer than average oceans to the northwest shelf of Australia, decayed early in October. This caused the oceans off the northwest shelf of Australia to cool from October onwards, which reduced moisture in the atmosphere.
Finally, the Madden Julian Oscillation (MJO), or a pulse of cloud and rainfall that moves eastwards around the equator, was located across the equatorial Indian Ocean last November. When the MJO is over Indian Ocean, it acts to suppress rainfall across Australia, which it did during November 2020.
Why did we see record breaking rain in November 2021?
In contrast to last year, La Niña has been reinforced by several other climate drivers in 2021, inducing:
- An active pulse of the Madden Julian Oscillation (MJO) in the Australian region
- A negative Indian Ocean Dipole (IOD) pattern in the Indian Ocean
- A positive Southern Annular Mode (SAM) to the south of Australia

Some places in eastern Australia have had their wettest November on record as a result of last month’s rain-inducing setup.
The last two years have been a vivid example of how much the impacts of La Niña can vary from event to event. So, while La Niña increases the likelihood of rainfall in Australia, it takes a whole-of-system approach to understand how each La Niña event will influence Australia’s weather.
Weatherzone continually monitors the state of Austalia’s key climate drivers and can provide your business with regular updates on the impacts. For more information, please contact us at apac.sales@dtn.com.




