
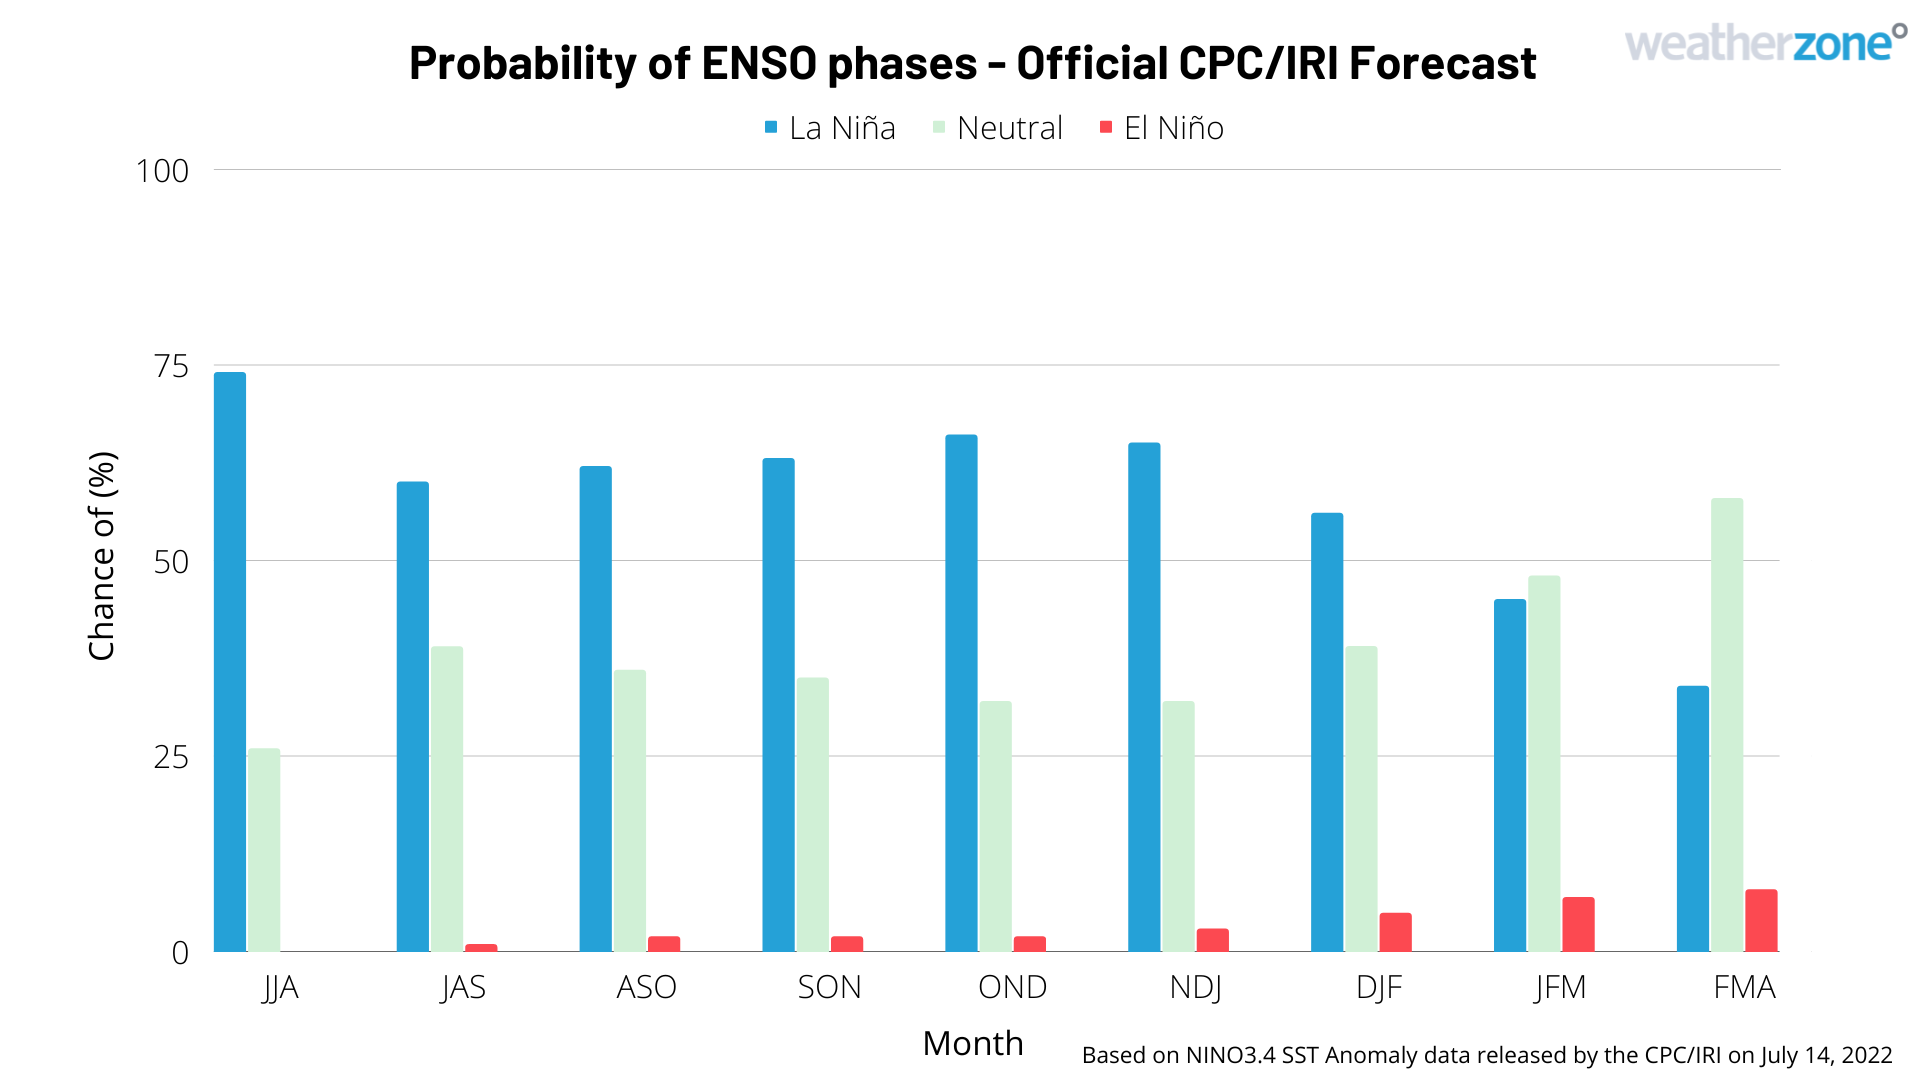
New data released overnight by the U.S. Climate Prediction Centre has increased the likelihood of a third consecutive La Niña later this year.
According to the Bureau of Meteorology, the Pacific Ocean has just come out of two back-to-back La Niña episodes, which ran from September 2020 to March 2021 and November 2021 to June 2022. This was the first double-dip La Niña in a decade.
But while the Pacific Ocean has now returned to a neutral state, it is still in a La Niña-like pattern and forecasts suggest that it may re-strengthen later this year.
Data released overnight by the US Climate Prediction Centre (CPC) and Columbia University’s International Research Institute for Climate and Society (IRI) shows that the probability of La Niña increases later this year. Their predictions give La Niña a 62 percent chance of occurring by early spring and a 65 to 66 percent chance in late spring and early summer.

Image: El Niño-Southern Oscillation (ENSO) forecast for the next 10 months, according to the U.S. CPC/IRI. The blue bars show the probability of La Niña occurring during each three-month period, with grey and red bars representing the probability of neutral and El Niño, respectively. Source: CPC/IRI
This outlook aligns with most other international forecast models, which also show an increasing likelihood of La Niña in the Southern Hemisphere’s spring and early summer.


Images: ENSO forecast for September (top) and November (bottom) 2022 from seven different international models, based on the Nino-3.4 temperature anomaly. Source: Bureau of Meteorology, issued on July 12.
The Pacific Ocean is currently in a state that has historically been conducive to the redevelopment of a third consecutive La Niña. The graph below shows the NINO3.4 sea surface temperature anomalies for all double-dip La Niña events in recorded history, with the dark blue lines representing years that went on to include a third consecutive La Niña. As you can see, the current event (black line) is sitting in the middle of the last two triple-dip La Niña events.

Image: History of NINO3.4 sea surface temperatures anomalies in the tropical Pacific Ocean for eight previous double-dip La Niña events. The dark blue lines show years that went on to produce a third consecutive La Niña. The black line is the current event. Source: CPC/Climate.gov
Looking further ahead, the majority of forecast models predict that the La Niña pattern in the Pacific Ocean should break down towards the end of summer, most likely returning to a neutral state early in 2023.
This outlook increased the likelihood of above-average rain and cooler-than-average daytime temperatures over large areas of northern and eastern Australia during the second half of 2022.
Weatherzone conducts detailed seasonal forecasts which can help with long-term planning out to six months. The seasonal forecasts are tailored to the business and can include risk of heavy rainfall and flood risk, tropical cyclones, thunderstorms, extreme heat, bushfires and much more. These forecasts can be delivered live online or face to face, allowing time for questions and increasing engagement.
For more information on our products or how we can help you with your business needs, please contact us at apac.sales@dtn.com.




