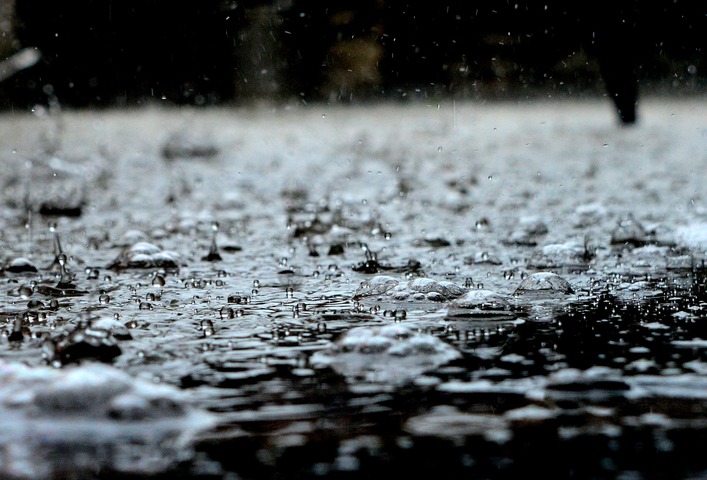
Close to a metre of rain has fallen in parts of eastern NSW over the last four days, with several rivers currently experiencing major flooding. So, how unusual was this rain event from a historical perspective?
A slow-moving low pressure trough and East Coast Low produced hundreds of millimetres of rain between the Illawarra and Hunter districts of NSW over the last four days.
The image below shows some of the standout rainfall totals during the 96 hours ending at 9am on Tuesday, July 5.
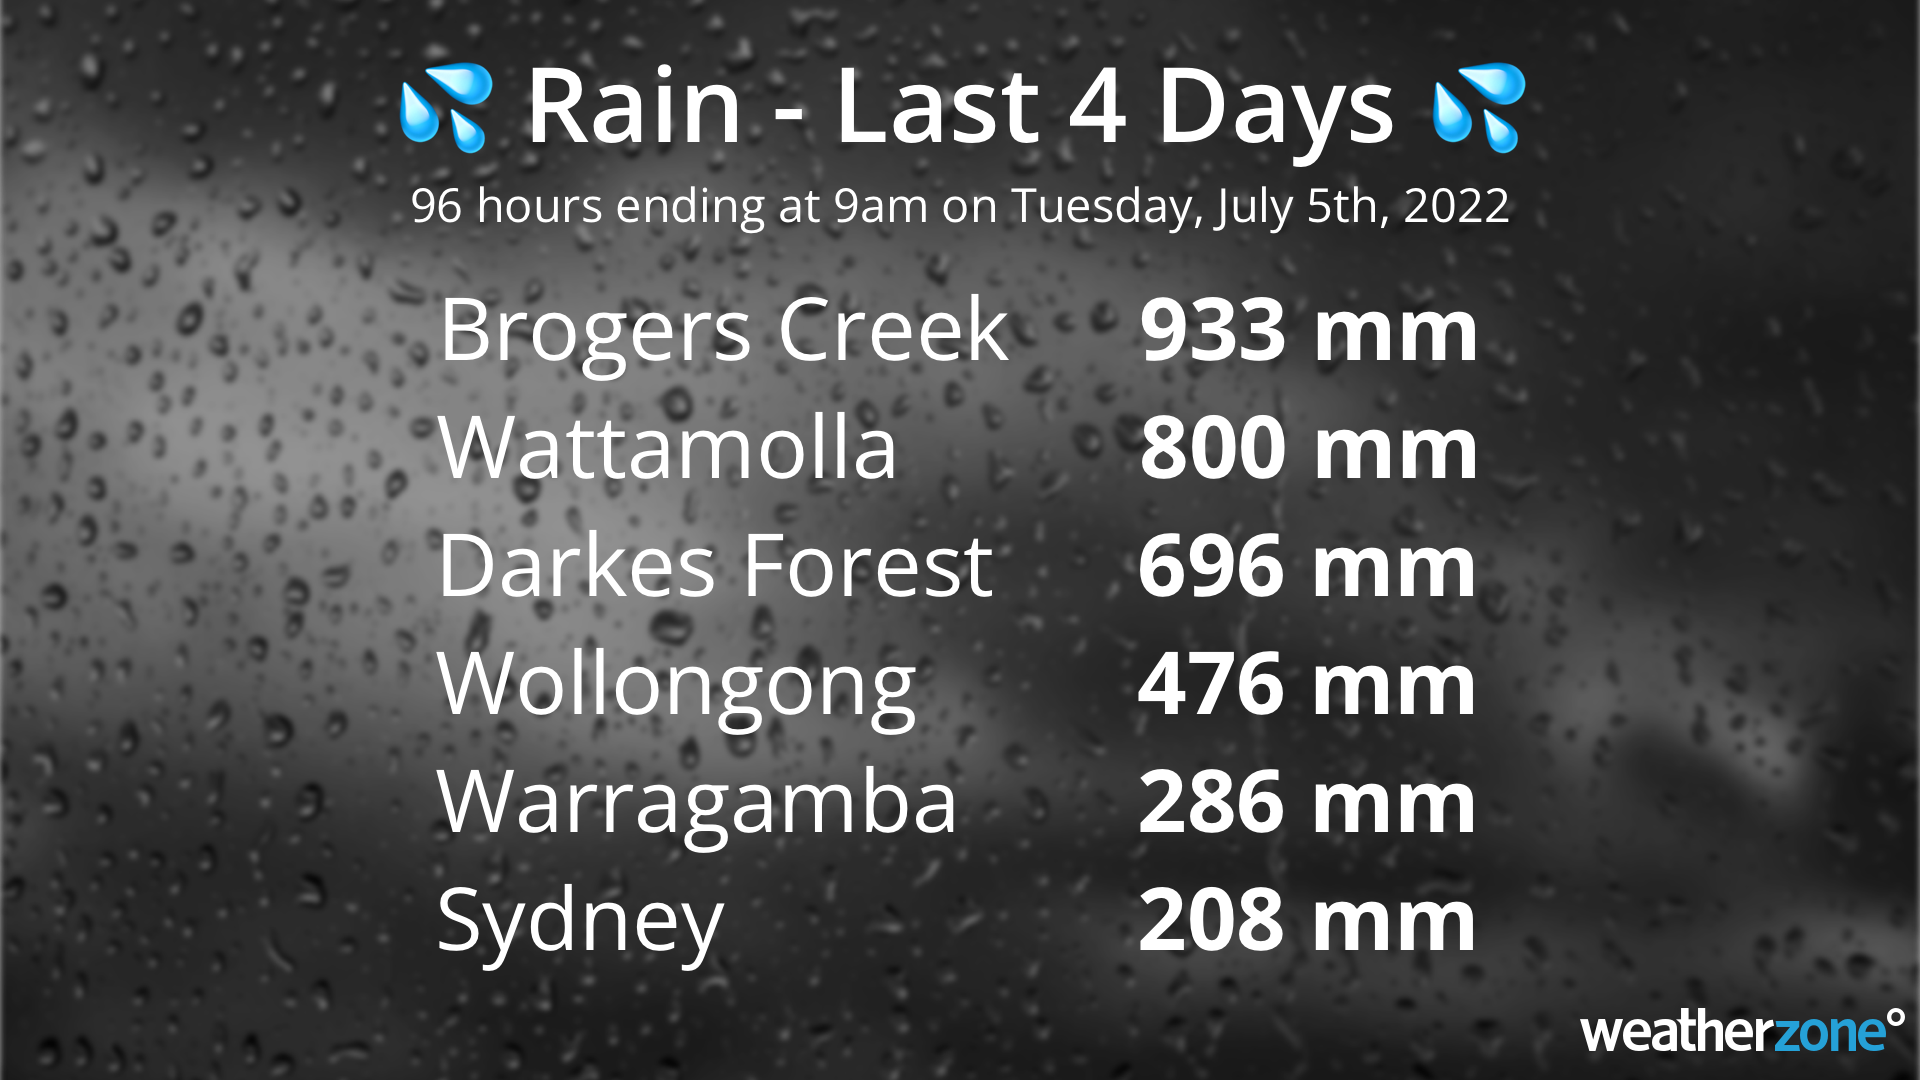
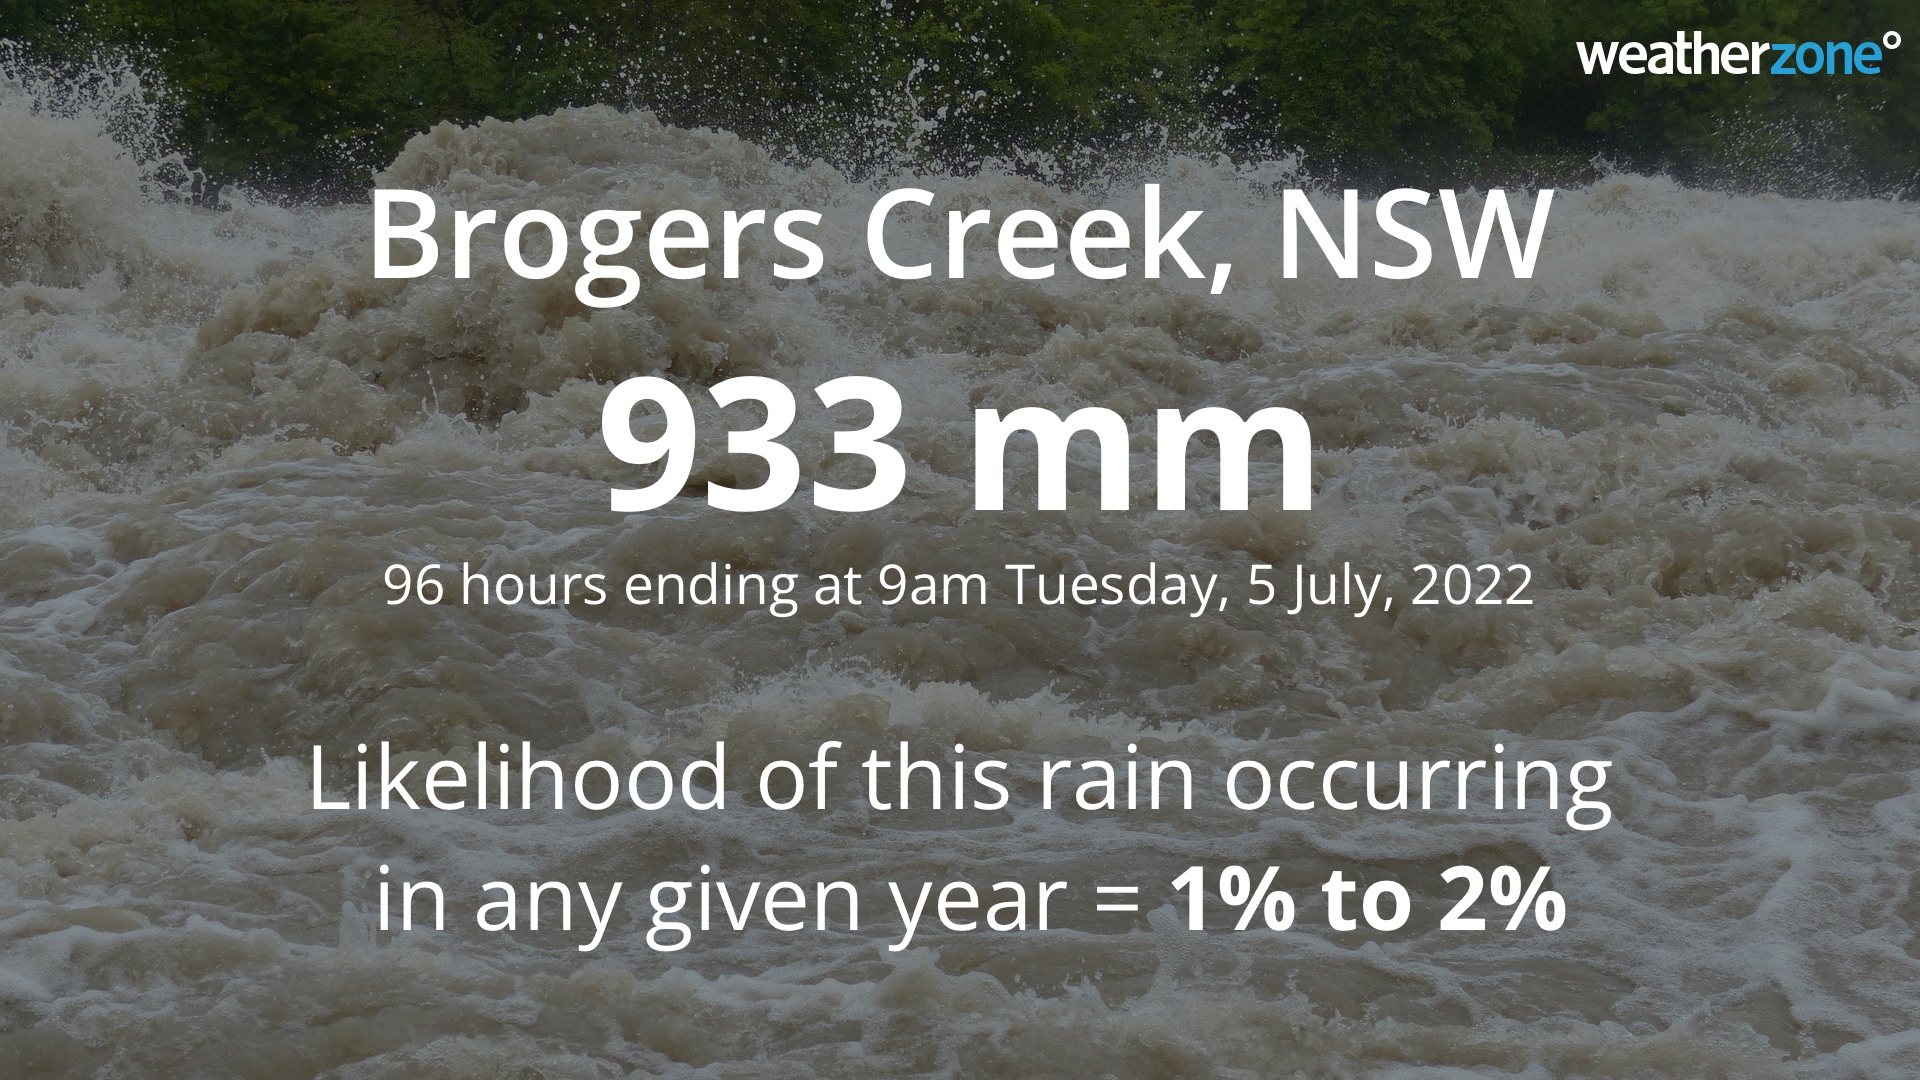
The heaviest rain from this system fell in the Illawarra’s Kangaroo Valley, where Brogers Creek collected a whopping 933 mm during 96 hours. This is more rain than Melbourne, Canberra, Hobart, Adelaide or Perth typically see during an entire year.
The probability of this much rain falling over four days at Brogers Creek is around 1 to 2 percent in any given year. Put another way, this is statistically between a 1-in-50-to-100 year rainfall rate for this location.
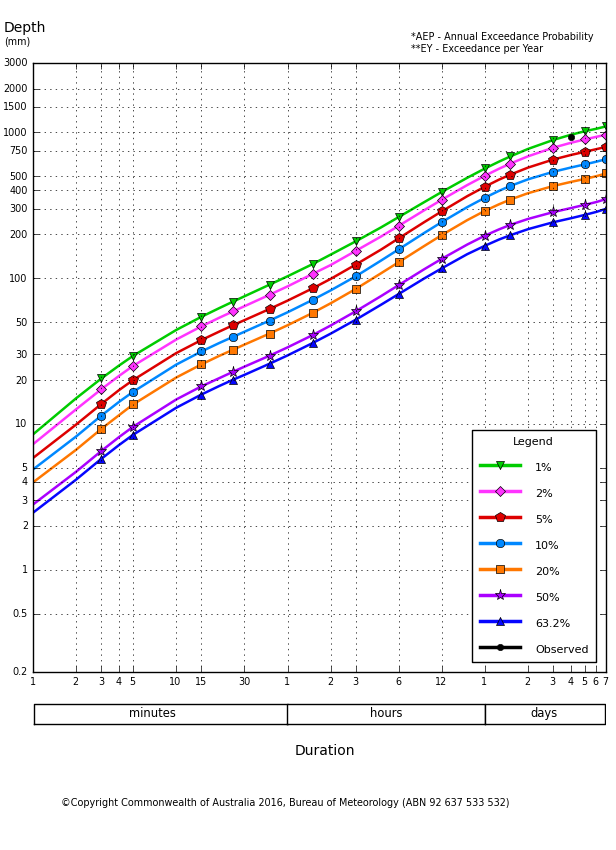
Image: Annual exceedance probabilities (AEPs) for different rainfall intensities and durations at the Brogers Creek, NSW rain gauge. The black dot near the top-right of the graph shows the observed 96-hour rainfall from the last four days. This dot sits between the 1 and 2 percent AEP lines for this location. Source: Bureau of Meteorology
While Sydney and surrounding areas escaped the heaviest rain from this system, there was still enough to cause major flooding in the Hawkesbury and Nepean Rivers to the west and northwest of the city. This included Windsor’s largest flood peak since 1978 on Tuesday morning.
As of 9am on Tuesday, July 5, Sydney Observatory Hill had already registered 221.2 mm of rain since the start of this month. This is already more than two times the city’s long-term monthly average and the its wettest July since 2011.
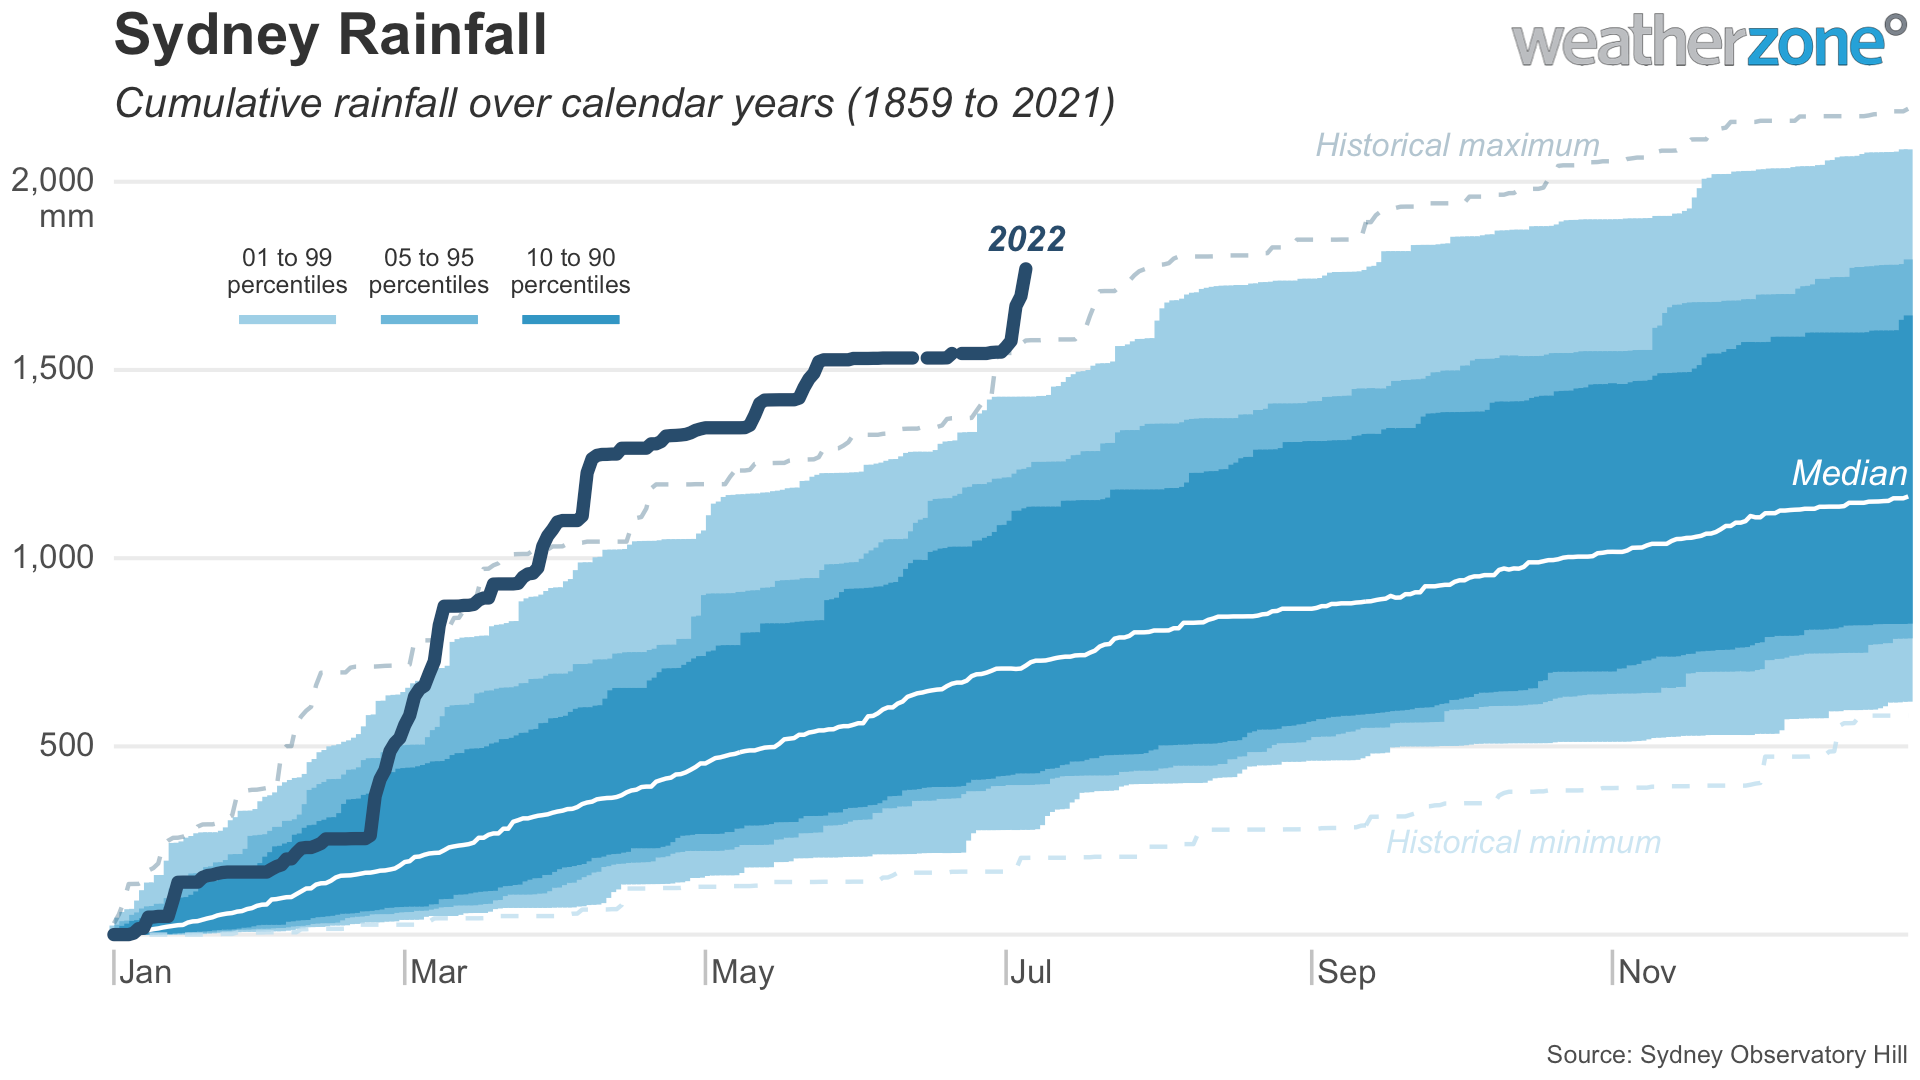
This wet start to July has pushed Sydney’s running annual rainfall total up to around 1769 mm as of 9am on Tuesday, making this the city’s wettest year-to-date on record.
 However, it is worth pointing out that while flooding has been worse than recent decades in some areas of Sydney, the rain that fell around the city in recent days wasn’t exceptionally heavy in a historical context.
While Sydney received 221.2 mm over the last five days, 245.8mm fell during five days in February this year and 287.6 mm fell over five days in March last year. From a probabilistic perspective, 221.2 mm over five days has a 20 to 50 percent chance of occurring in any given year, which is a 1-in-2-to-5 year rainfall rate for Sydney.
Further west, Warragamba’s 286 mm of rain during last four days is a rain rate that has a 10 to 20 percent likelihood of occurring in any given year, making this a 1-in-5-to-10 year event for the site.
For some areas of eastern NSW, this rain event has been extraordinarily heavy and is the kind of rainfall we would only expect to see once or twice a century. However, some areas were simply inundated by more typical rain that fell onto already saturated ground and into full dams.
This weather event has been a good example of how repetitive extreme rainfall events over a relatively short space of time can cause significant flooding. For more information on Weatherzone’s products and forecasts, please contact us at apac.sales@dtn.com


