
Flooding rainfall has impacted many parts of Australia in recent weeks and signs are that the situation will worsen through the remainder of September, particularly across Southern and Eastern states.
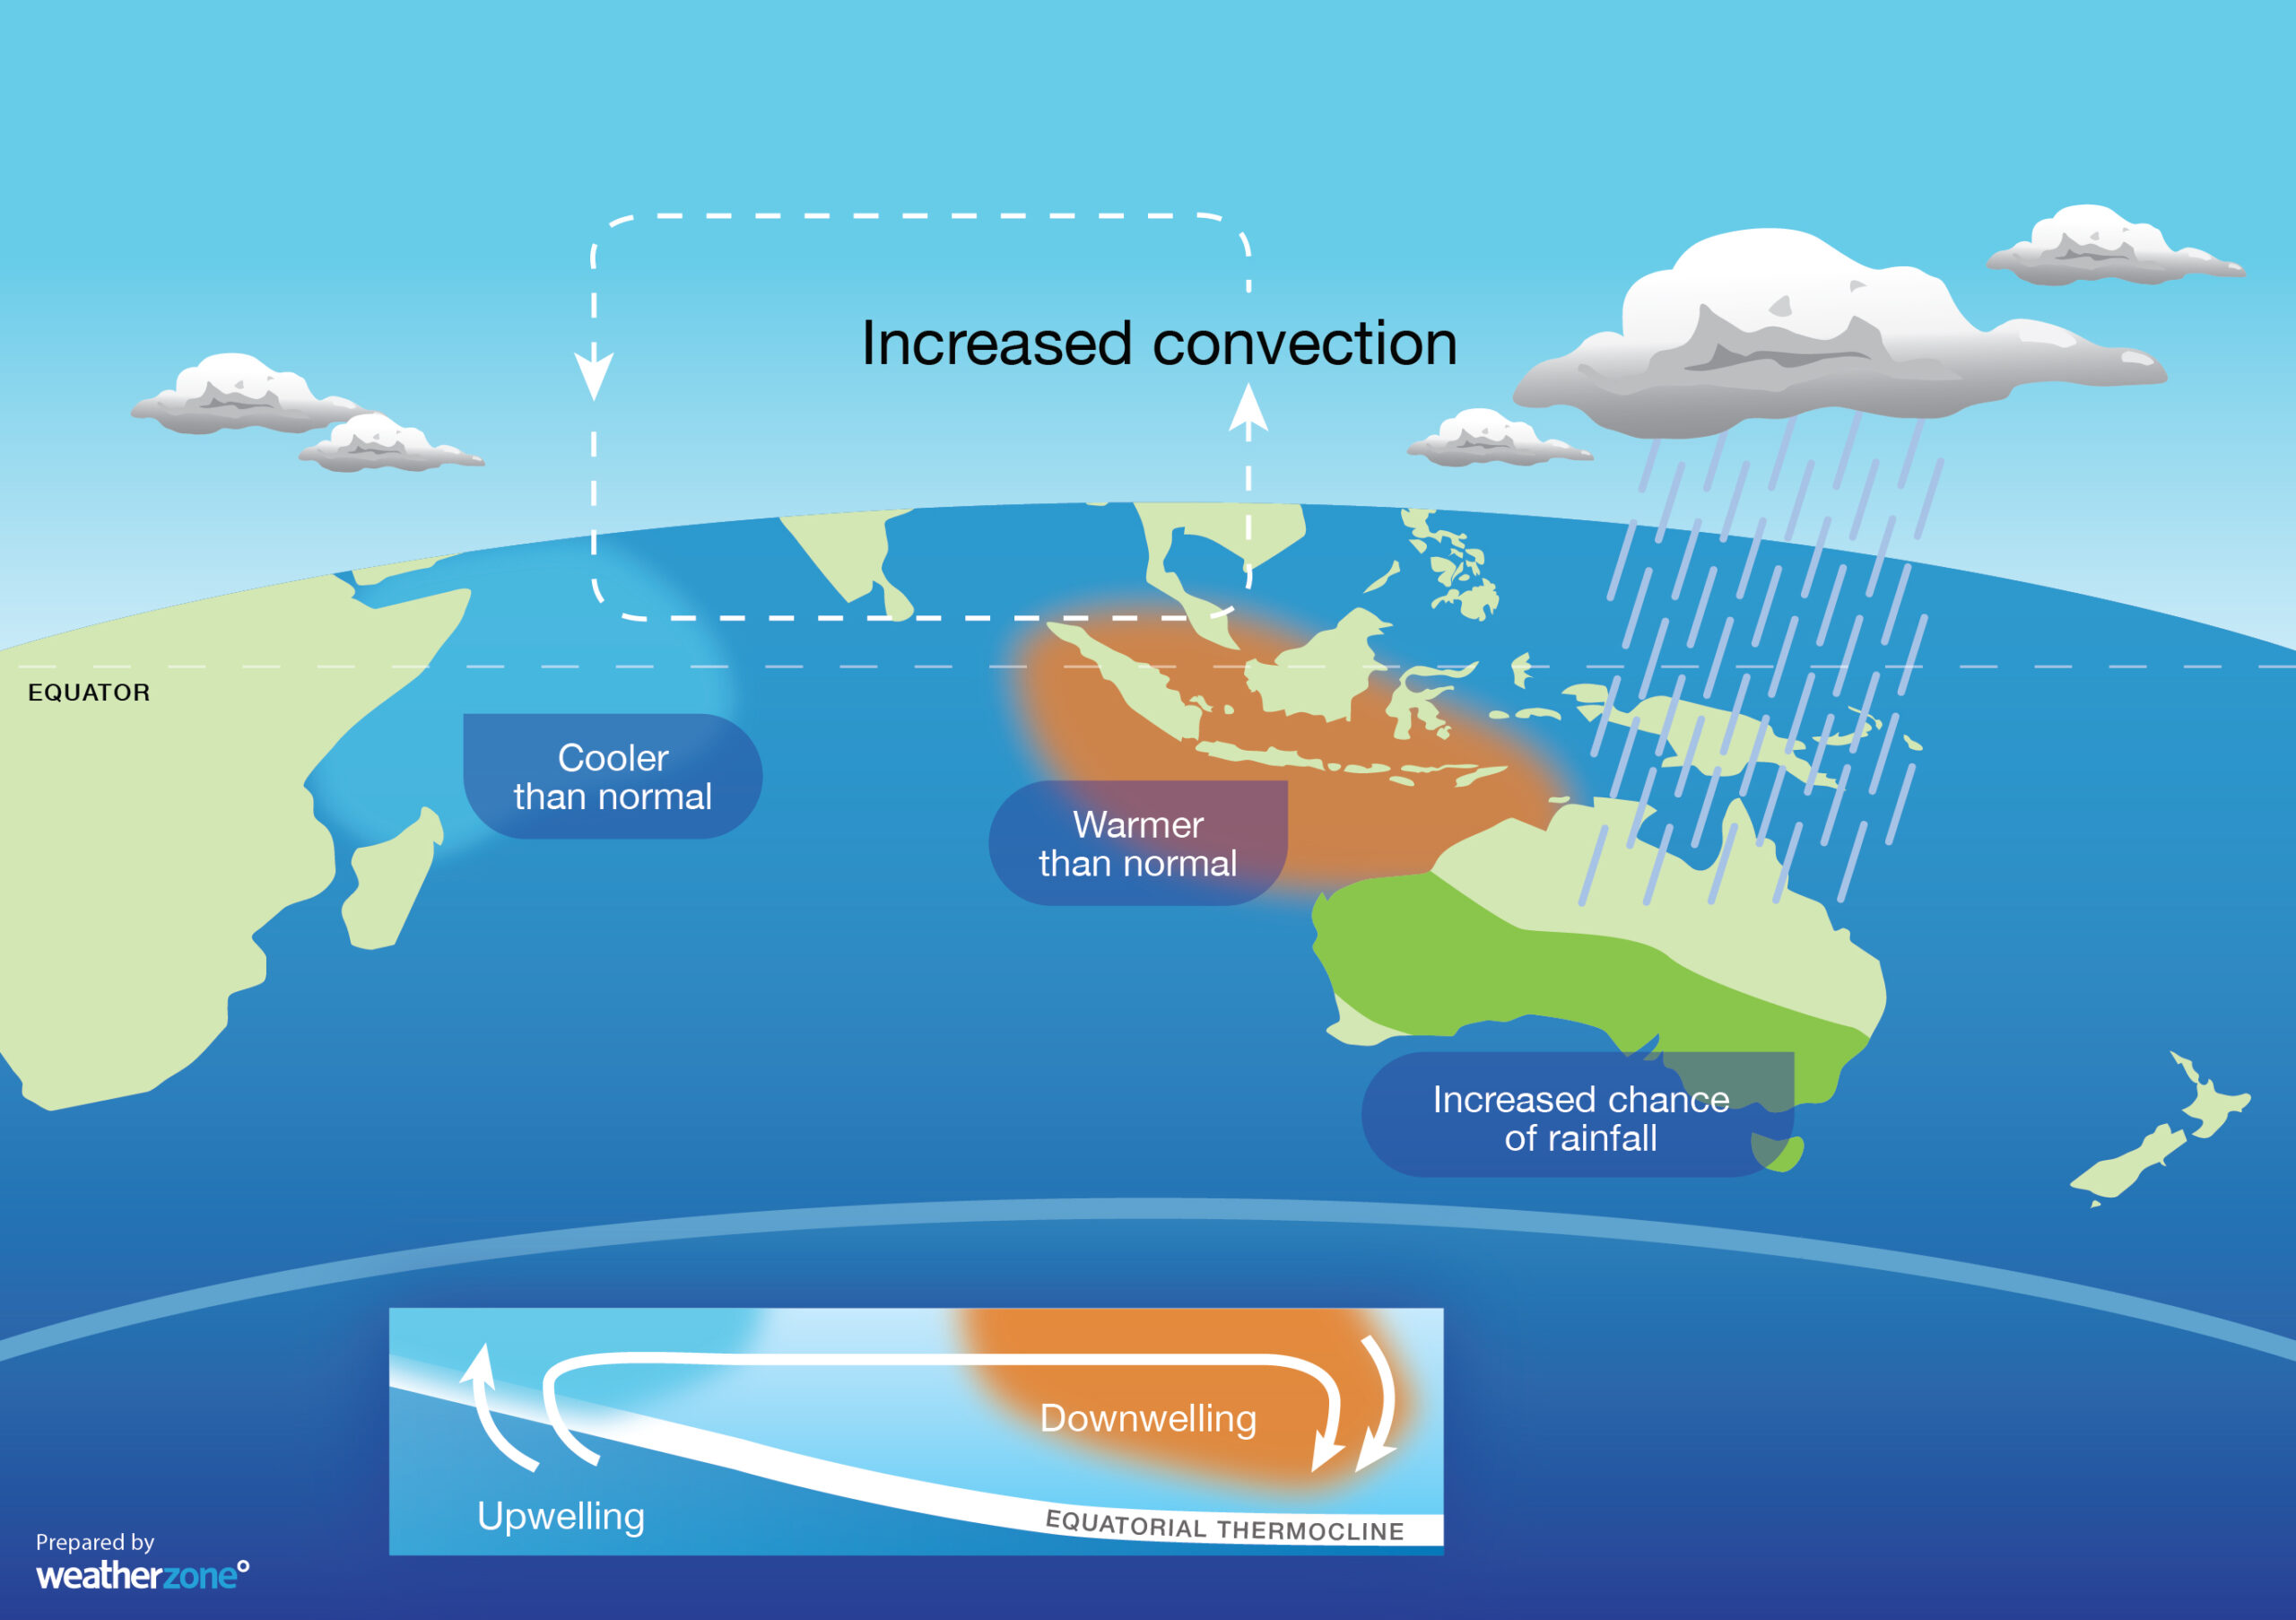
There are large scale global factors at play here, with the Indian Ocean Dipole (IOD) in a strongly negative phase and the Pacific displaying ‘La Nina like’ characteristics. These two patterns are referred to as ‘climate drivers’, as they drive the climate in one direction (in this case towards wetter than usual conditions).
For large parts of Australia, the negative IOD and La Nina both bring wetter than usual weather during the spring and summer months. The negative IOD has the greatest impact on rainfall in southern and central Australia during late winter and spring (as we have seen), while La Nina contributes to above average rainfall through northern and eastern Australia during summer and shoulder months. The last time a similar negative IOD and La Nina pattern was seen was in the spring of 2010, which set the scene for a summer of flooding across the eastern states (including the Brisbane floods).
Beyond these large scale influences, Australia is stuck this month with a weather pattern that is on repeat. The highs and lows seen on the nightly news weather chart are referred to as synoptic scale systems and often have a lifespan of one week or so. Low pressure systems and cold fronts will sometimes reach peak strength in a similar spot on the globe for a few weeks on end, due to the position of a slow moving wave-like pattern around Antarctica. This is currently the case for Australia.
Weather systems crossing Australia at present also have a strong north-south component to them (known as a meridional pattern), which has a twofold impact.
- The strong north-south component of the repeating weather pattern is helping to draw large quantities of moisture-laden air across Australia from tropical maritime areas down central and southern parts of the continent
- These meridional patterns are also slow-moving as they cross the Australian continent, allowing heavy rainfall to fall for days on end
This type of meridional pattern is less common than the usual ‘zonal flow’ that we see across Australia, where cold fronts and other synoptic features zip through from west to east in a day or two.
The current numerical weather modelling is showing the risk of further heavy falls through the next 14-days, which has the potential to worsen flooding through southern and central Queensland, inland NSW (west of the Divide), most of Victoria (outside of Gippsland), northern Tasmania, much of South Australia and southern parts of the Northern Territory.
As was seen in the spring of 2010, heavy rainfall at this time raises the risk of more widespread and severe flooding during the summer months. This is because river catchments may already be in flood, and runoff rates higher from saturated soils, when the wet season arrives through northern and eastern Australia. Aside from the disruption and risk to daily life from flooding rains, businesses of all types should have strategies in place to mitigate the risk of a wetter than usual end to 2016.
To learn more about how Weatherzone can help your business to manage risk through seasonal forecasts, high precision local forecasts and flood risk systems, please contact us here http://apac.dtn.com/contact/.




