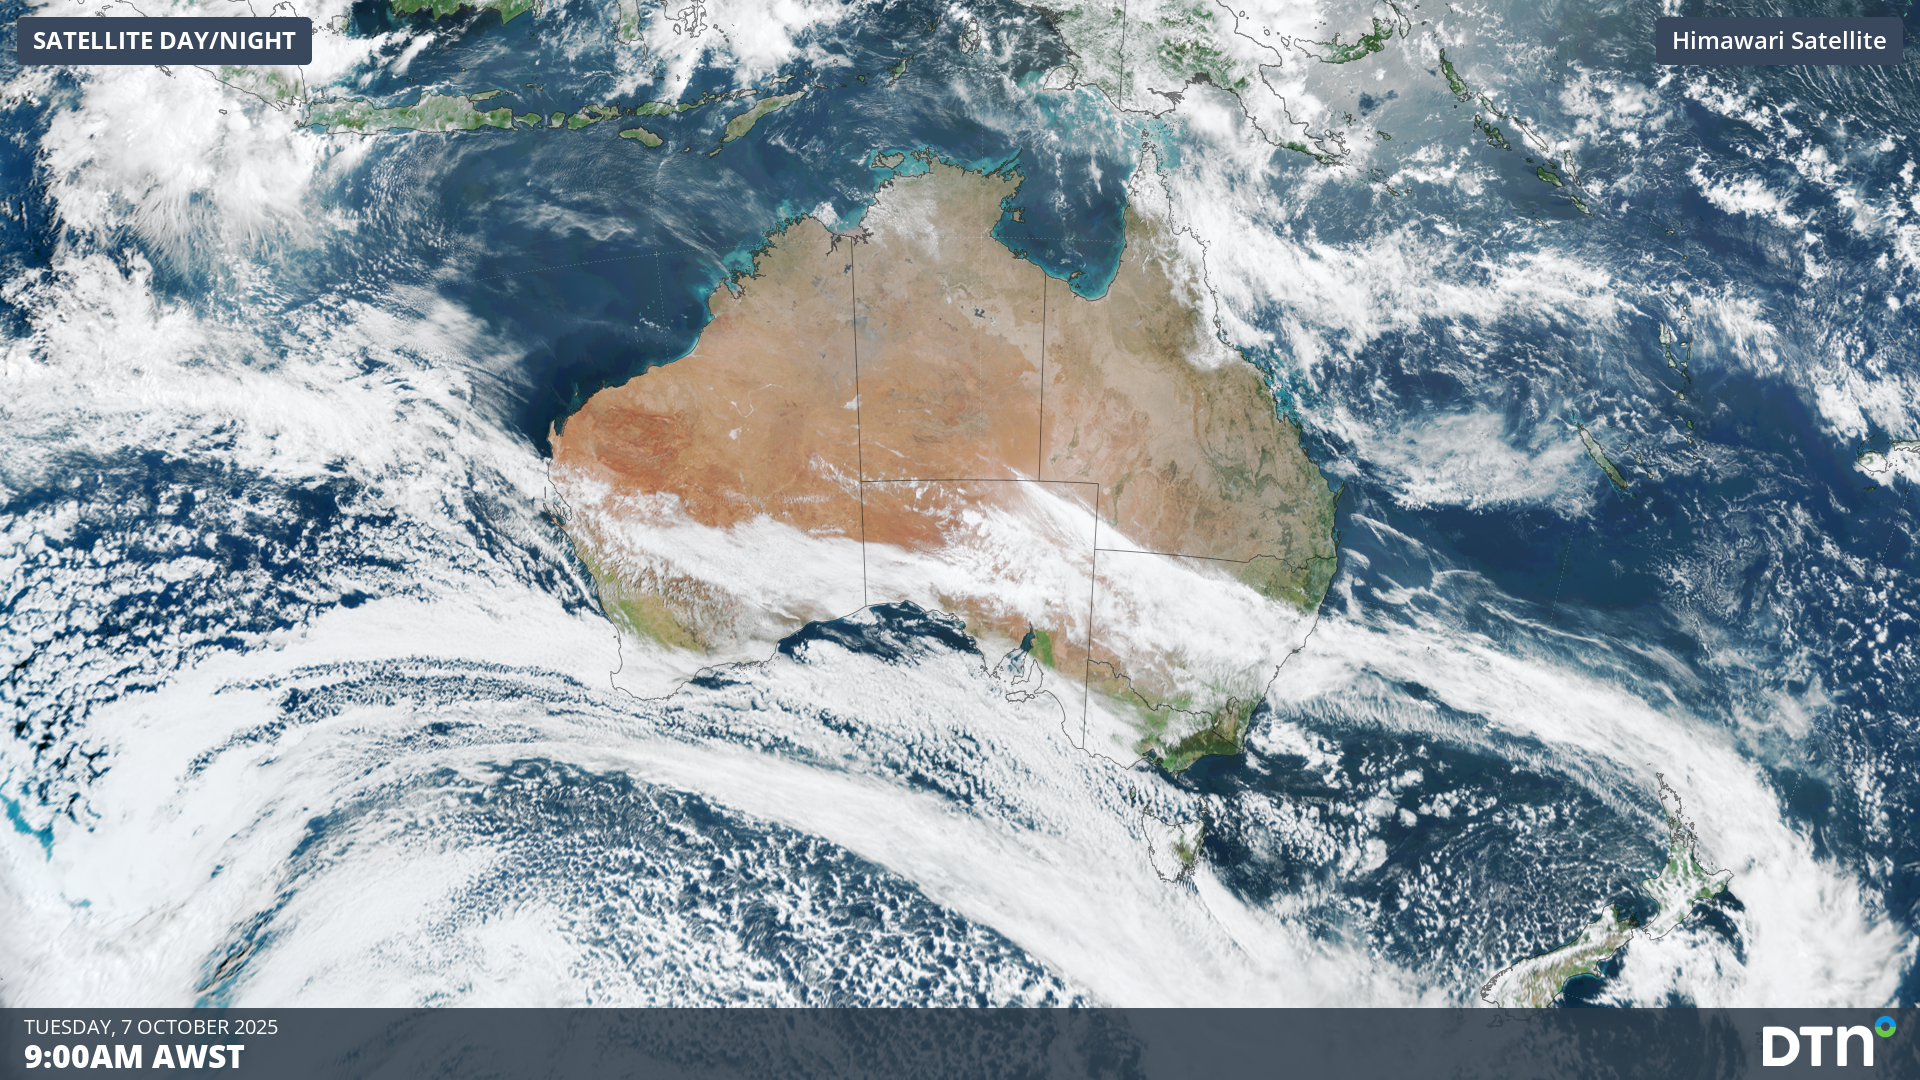
A huge northwest cloudband stretching from Indonesia to waters east of New Zealand has delivered the heaviest October rainfall on record to the WA gold mining city of Kalgoorlie.
Extending at least 8000km, the cloudband has brought rain over the past couple of days not just to WA, but all the way east to large parts of SA, NSW, Victoria and Tasmania.
Rainfall totals in most areas have been moderate to date with this system. Of the southern capitals, only Adelaide has broken 10mm on any single day, with 11.4mm in the 24 hours to 9am Monday. While this was hardly a drenching, it was welcomed by locals as it was the heaviest day of rain since July.
By far the most notable rainfall total to date was in Kalgoorlie in the WA Goldfields region, where 60mm was recorded in the 24 hours to 9am Monday. This was:
- Kalgoorlie’s heaviest day of October rainfall since records were first kept in 1939, beating the old October daily record of 45.6mm.
- Almost four times the October monthly average of 15.5mm in a single day (October is typically Kalgoorlie’s second-driest month of the year).
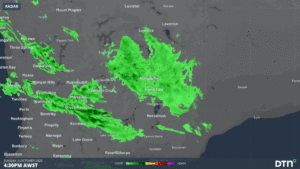
Image: Eight-hour radar loop for Kalgoorlie, WA, up until 3:30am (AWST) on Monday, October 6, 2025.
What caused the Kalgoorlie downpour?
The heavy rain in and around Kalgoorlie was caused by a near-stationary surface trough which concentrated moisture from the cloudband in the area.
It’s also worth noting that northwest cloudbands tend to bring more rain to inland and eastern WA than the (normally wetter) southwest, as by definition they stretch from NW to SE across the country.
READ MORE: What is a northwest cloudband?
Meanwhile as we head into Tuesday afternoon, the cloudband continues to deliver light rainfall to parts of inland SA and NSW as it streams eastwards across the country.
While this particular system is unlikely to deliver further significant rainfall totals, there are strong signs that similar weather systems could push more rain across Australia in coming weeks.
Northwest cloudbands form when warm, humid tropical air over the Indian ocean moves towards the southeast and passes over Australia, rising over cooler air in the mid-latitudes to produce clouds.
These cloudbands are more common when the Indian Ocean Dipole (IOD) is in a negative phase. A negative IOD means that waters off northwestern Australia are warmer than usual – increasing the moisture content of upper level winds and enhancing the potential for northwest cloudbands to form.
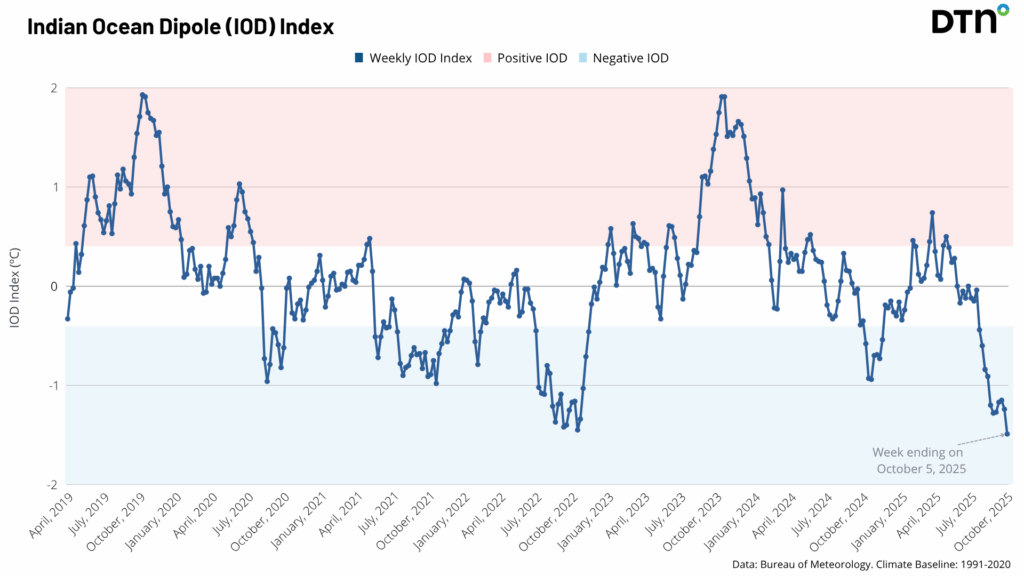
Image: Phases of the IOD since 2019.
As the chart above shows, the IOD is currently in its strongest negative phase for several years, paving the way for the consistent occurrence of rain-bearing northwest cloudbands in coming months.
How the DTN APAC Flood Risk System works for your business
Using an advanced geofence technology, hundreds of virtual ‘weather stations’ are created for each chosen catchment areas determined by you. No matter how remote the catchment is, DTN APAC’s Oracle gives precise determination of rainfall intensity and accumulation. Oracle is a satellite-derived gridded nowcasting system, forecasting at a 1-2km resolution which updates every 5 minutes, giving it the upper hand on traditional 9-12km resolution models.
The image below shows how past, current and future rainfall is measured across each catchment in relation to thresholds defined by you. Alerts are raised when rainfall accumulations approach or breach maximum capacity threshold, giving you targeted visibility of active and future flood risk to inform operational responses.
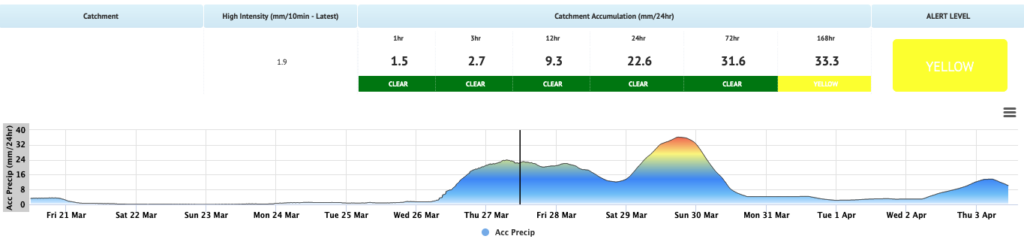
Image: The Flood Risk System dashboard giving visibility of past, current and future rainfall accumulations over the customised catchment.
Flood risk alerts are delivered via SMS, email and our industry app Weatherguard, providing immediate situational awareness. The risk system is easily integrated into any DTN APAC interface or existing dashboard. Rainfall data can be supplied to a third party to integrate hydrology and culvert alerts for your site, elevating risk visibility.
Be prepared for flooding, whether it directly impacts your safety on the ground, water supply, cuts off road access or rail lines, or restricts your access to assets.
Learn more about our large range of industry leading products and services or email us at sales.apac@dtn.com


