A northwest cloudband and thunderstorms soaked the Pilbara on Wednesday, delivering five times the June average rain in a day at one town.
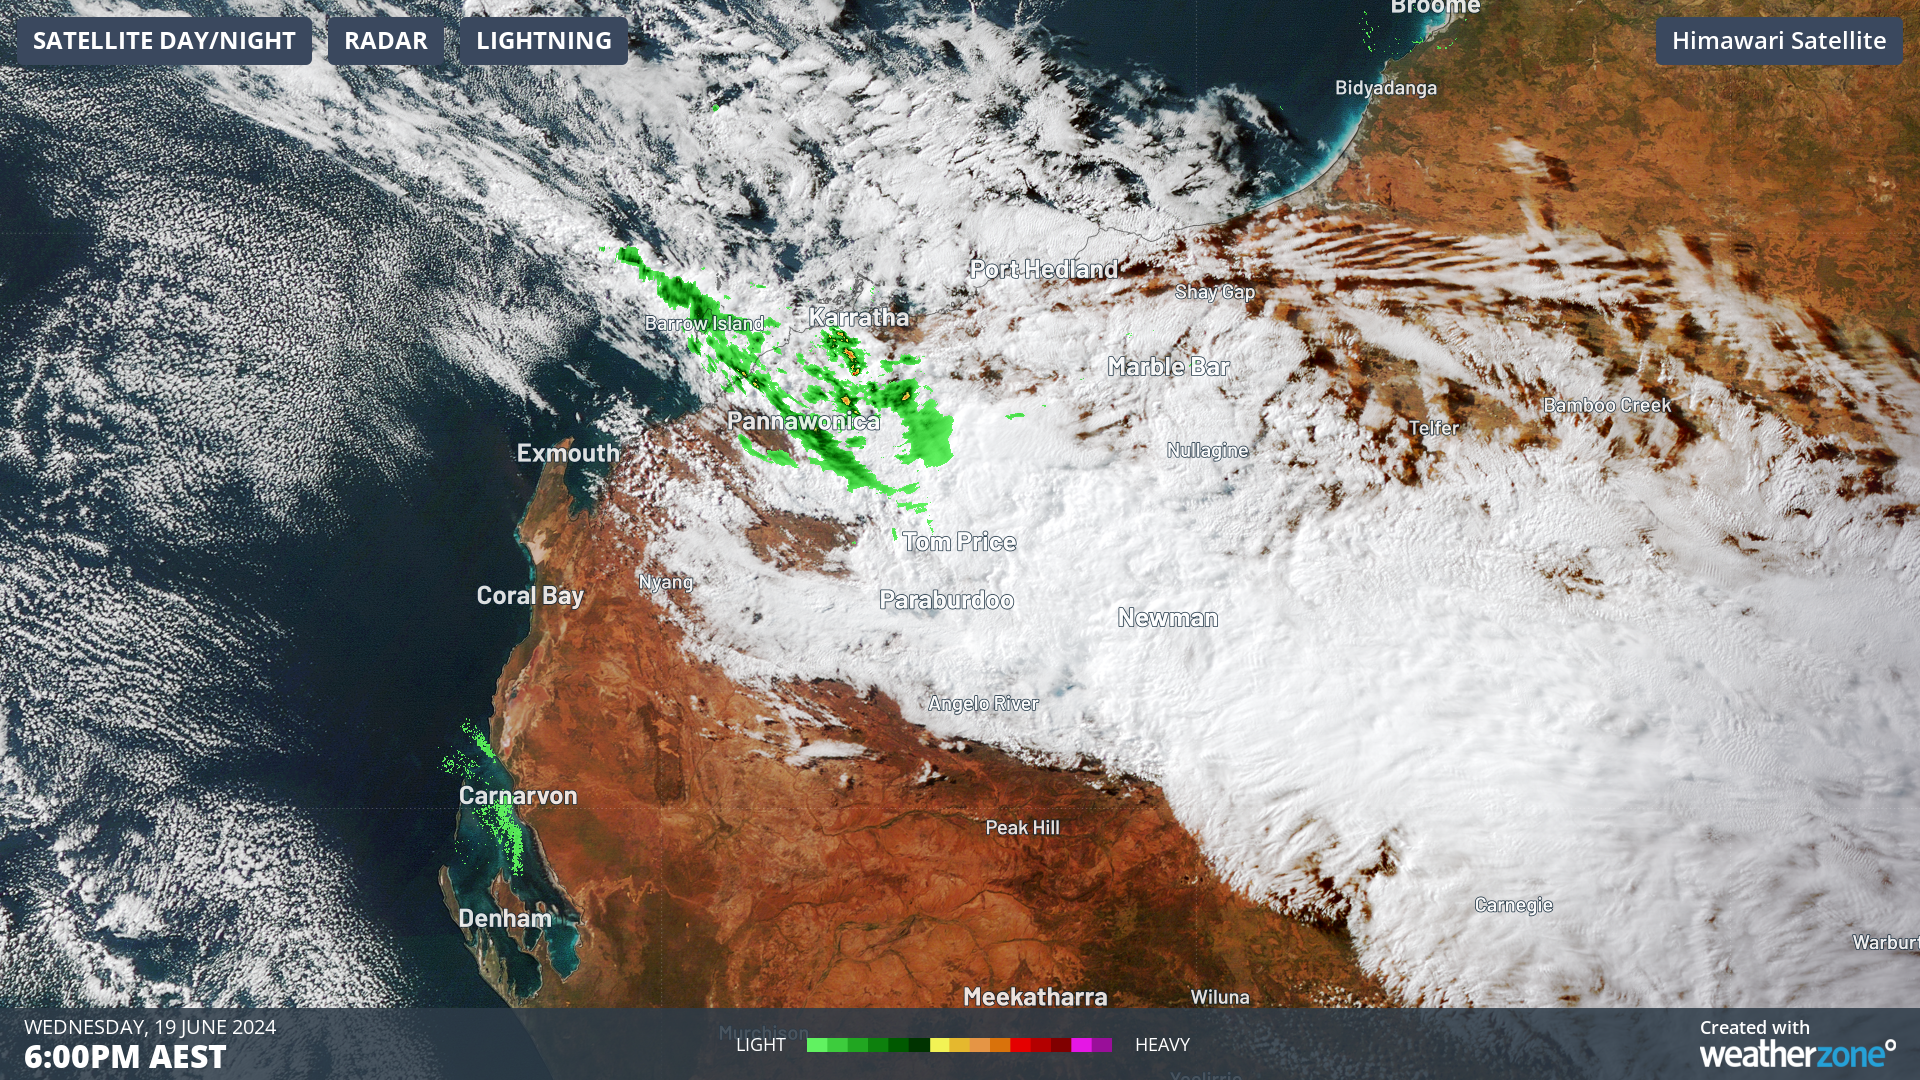
The images below show thick cloud, rain and thunderstorms streaming into the Pilbara region from the Indian Ocean on Wednesday afternoon.
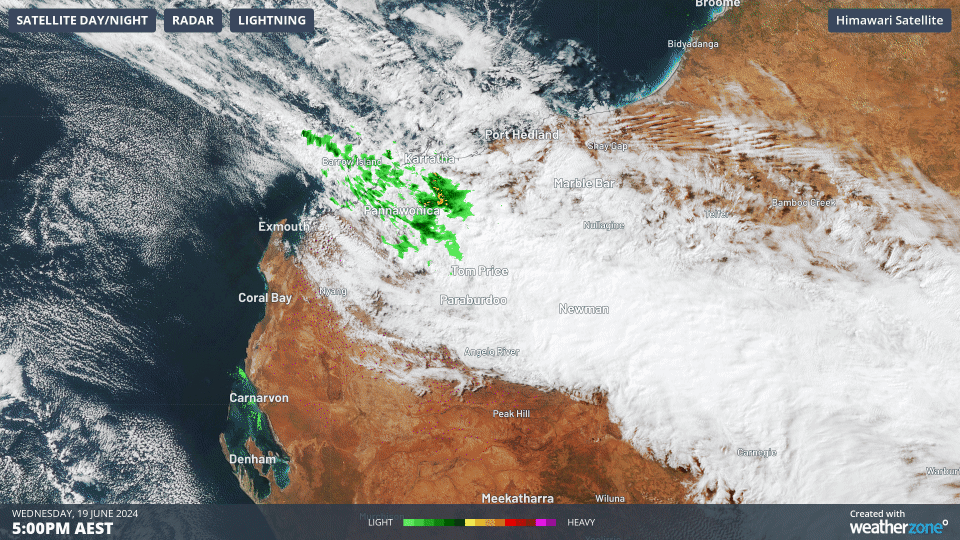
Image: Himawari-9 satellite images for the three hours leading up to 6pm AWST on Wednesday, June 19.
The highest falls recorded in the 24 hours leading up to 9am on Thursday, June 20 were;
- Karijini North recorded nearly six times their June average (only five years of data), with 63.6mm falling in the guage
- Flat Rocks observed 55mm
- Upper Portland recorded 50mm
- Mount Florence saw 38mm, nearly two times the June average
- Coolawanyah observed 37mm
- Solomon Airport received nearly four times their monthly average, with 31.6mm
Much of this rain fell into one catchment, the Fortescue River Catchment, but the river remained below flood levels.
The northwest cloud band has moved eastward and weakened on Thursday, with rain and thunderstorms clearing the region. While the rain has cleared, strong and gusty southeasterly winds should continue over the Pilbara and Kimberley regions on Thursday and Friday.
Looking ahead, a strong cold front will sweep across the southwest of the state on the weekend bringing rainfall to the southern half of WA.
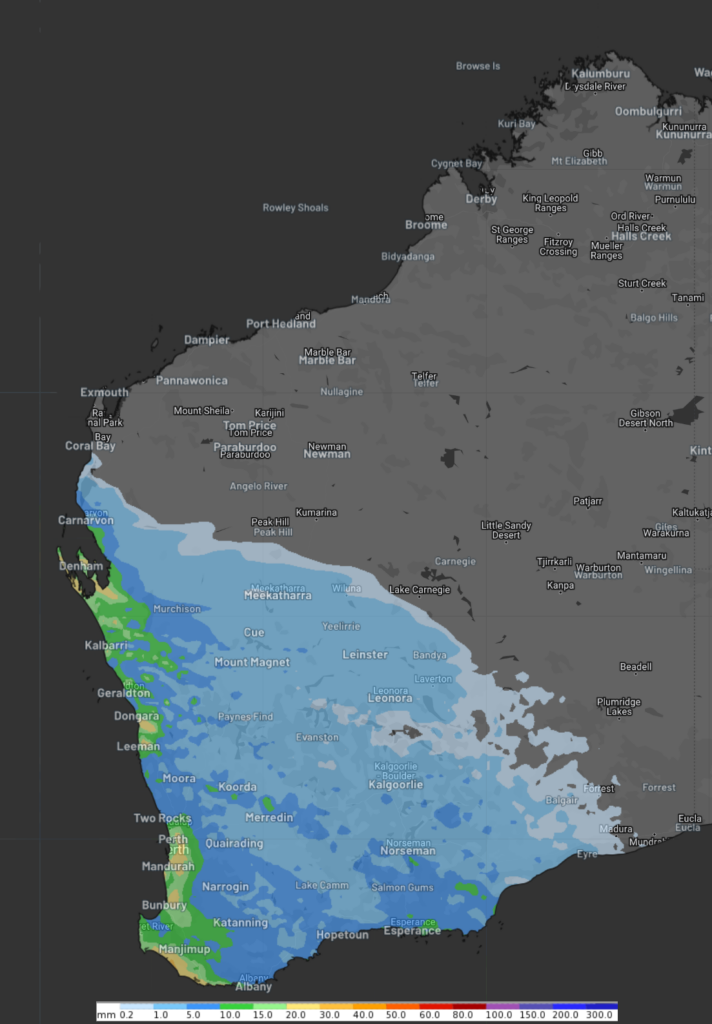
Image: 24-hour accumulated rainfall to 11pm AWST Saturday, June 22, according to ECMWF
You can see in the image above that the models suggest this rain will miss the Pilbara and Kimberley on the weekend, although it may be more cloudy than normal.
Stormtracker is a severe weather solution that can assist you in observing, in real-time, any storm or event that has the potential to impact your business.
Embedded in DTN APAC’ industry interfaces, the system gives you a time advantage when monitoring conditions developing over your infrastructure and location.
Stormtracker is our Global Information System (GIS) tracking tool, providing multiple weather layers and zoom controls overlaid on a map of your location and infrastructure. You can choose a snapshot or full screen view, depending on your requirements. The maps allow you to monitor all weather, and specifically any systems likely to cause risk for your business. You also have the capacity to observe:
- real time lightning and thunderstorm alerts
- localised lightning strike frequency
- official warnings for storm, cyclone, wind, flood and fire
- sentinel hotspot fires and fire agency current incidents
Stormtracker’s radar imagery updates every 10 minutes, so you are always able to respond rapidly to changing conditions. You can customise alerting to notify you when your staff or infrastructure are under threat. With increased situational awareness, your ability to make informed decisions quickly is optimised.
DTN APAC’ experience and intelligence gives you a clear path through complex situations. Let us assist you, offering actionable insight when extreme weather poses risk to your business. To find out more, please contact us.


