Solar output in the east has taken a hit recently, with more cloud to come, but the wind has picked up, keeping renewable penetration stable in the market.
The image below shows thick cloud over the eastern half of the country on Thursday afternoon.
![]()
Image: Himawari-9 satellite image at 12pm AEST on Thursday, May 9.
The combination of an upper-level trough sitting near SA and a high-pressure system over the Coral Sea is transporting moisture all the way from Papua New Guinea across eastern Australia.
The blue and pink shades in the map show excessive amounts of precipitable water; in other words, the map shows a large amount of available atmospheric moisture which can be rained out. The black lines show the wind direction at 500hPa (6km above the surface) with an upper low sitting over SA and an upper high-pressure system over the Coral Sea moving moisture across Australia.
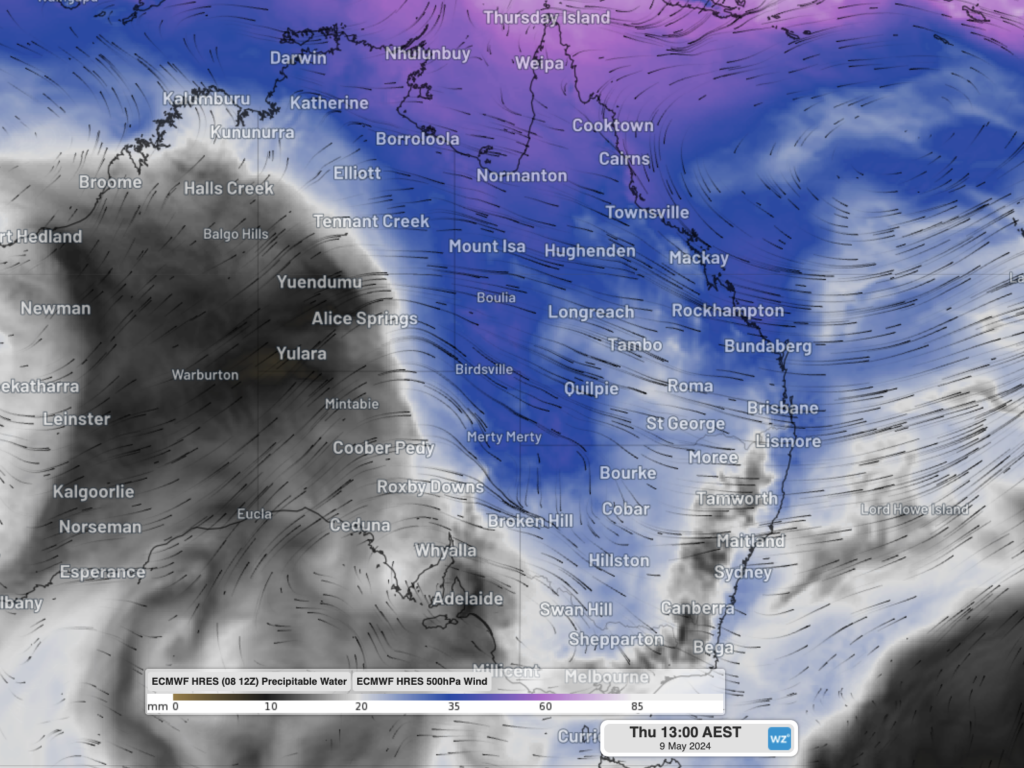
Image: Precipitable water forecast at 1pm on Thursday, May 9, according to ECMWF
The map below shows that rooftop and utility solar (yellow) has dropped in recent weeks; however, the total renewables contribution (blue line) has remained stable over the last month.
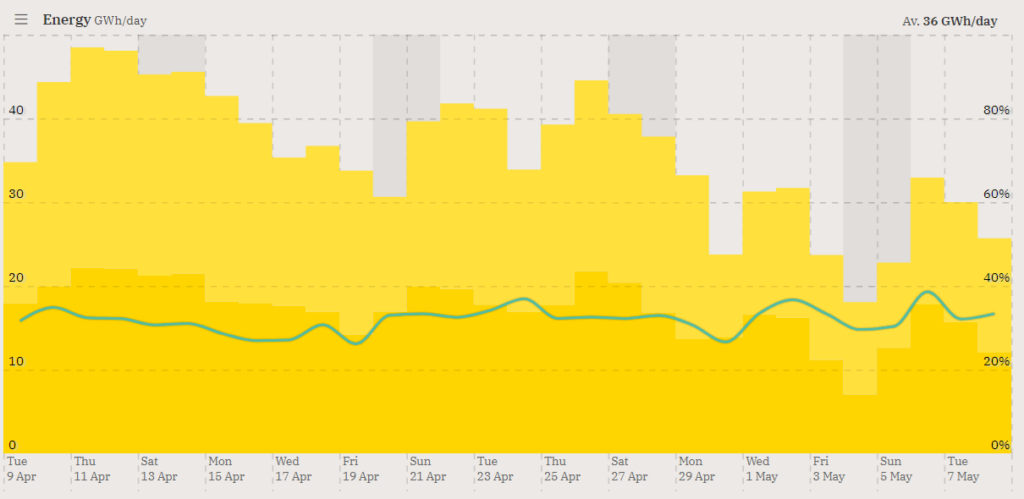
Image: Rooftop and Utility solar (yellow) and total renewables (blue line) contribution to generation (energy GWh/day for 30 days between Tuesday, April 9 and Wednesday, May 8), Source: OpenNEM
While solar has dropped, the wind has picked up, which has helped the renewable energy penetration stay stable over the last month. By this time of year, prevailing winds from the west of around 9 km/h on average are common in southern NSW. However, during the first week of May 2024, winds averaged 18 km/h from the southeast. So, the wind is coming from a different direction and double the usual speed. This favours eastern wind farms, especially those near the ACT. 
Image: Wind anomaly (1991-2020 climatology) for the first week of May 2024 showing stronger than normal easterly winds over southern Australia. Source:NOAA
Looking ahead, this pattern is expected to last an extra week, with another wet weekend on the cards for the east coast.
Weatherzone Business and Solcast are a market-leading partnership delivering highly specialised solar data to the Australian renewable energy industry. For more information, please contact us at apac.sales@dtn.com.


