Tasmania has seen a wet and windy July, with cold front after cold front marching over the region filling hydropower dams in the region.
The image below shows the last week of July was particularly wet for northwestern Tasmania, with several cold fronts smashing into the region. Over the last weekend, Maatsuyker Island recorded a wind gust of 178 km/h, the equalling the state record for strongest gust during July.
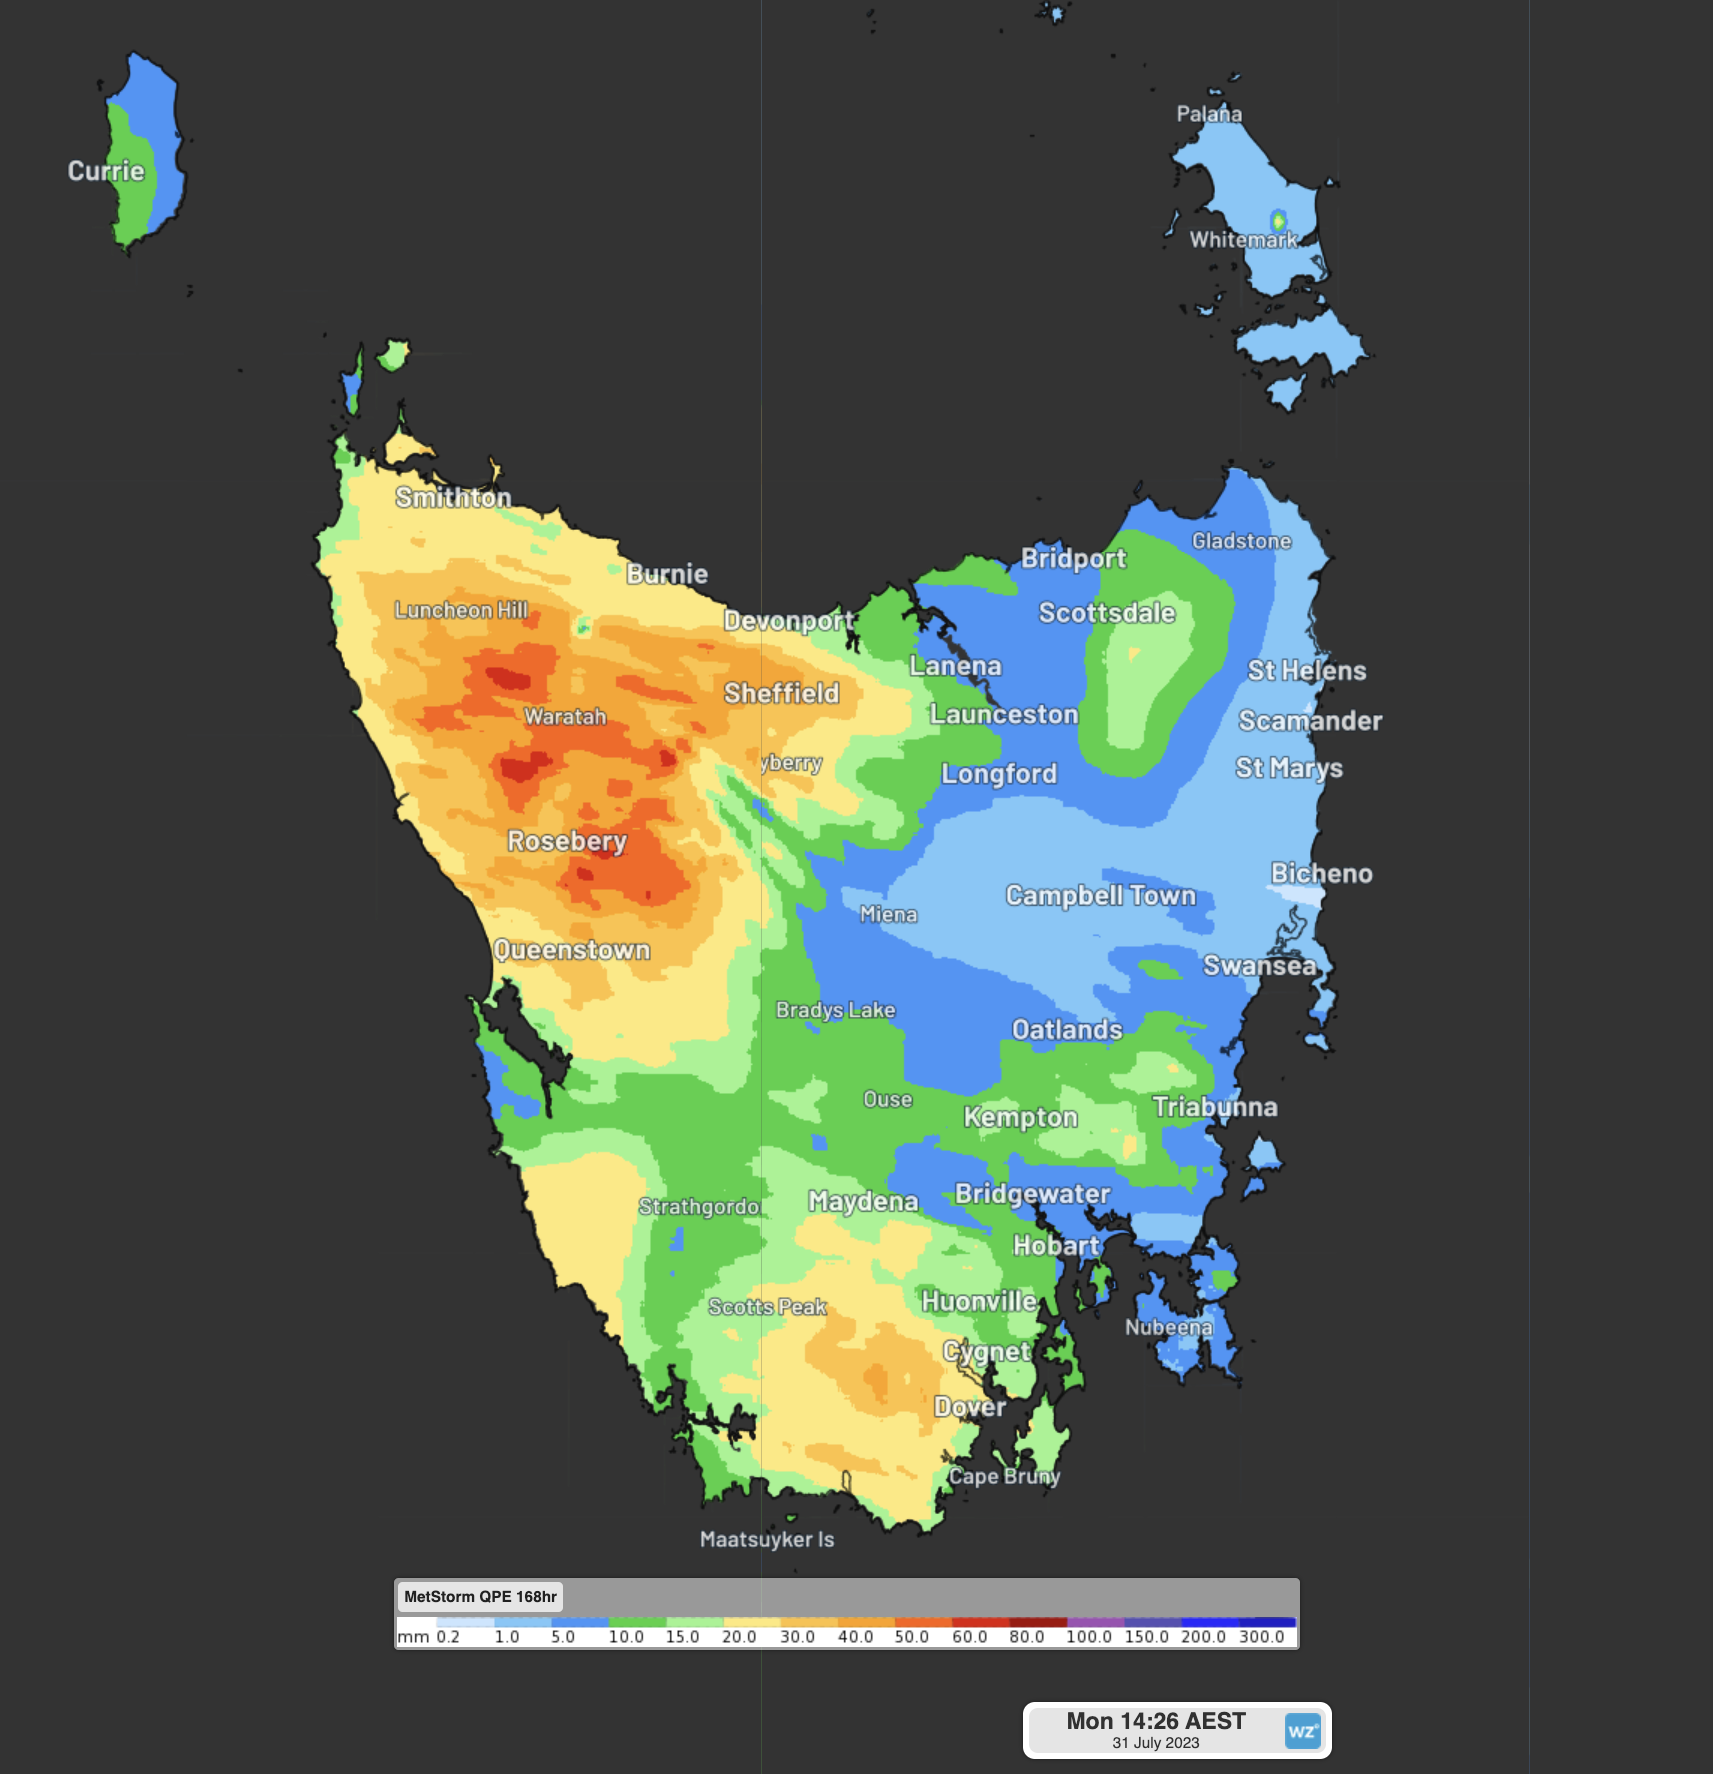
Image: Observed rainfall over Tasmania between 24th and 31st July.
The west coast of Tasmania is very exposed to cold fronts that sweep across the Bight and Bass Strait, often picking up the highest totals in the state.
Mount Read, Australia’s wettest weather station outside of the tropics, had its third wettest July on record with 626.8mm of rainfall, just shy of the record of 653mm in 2018.
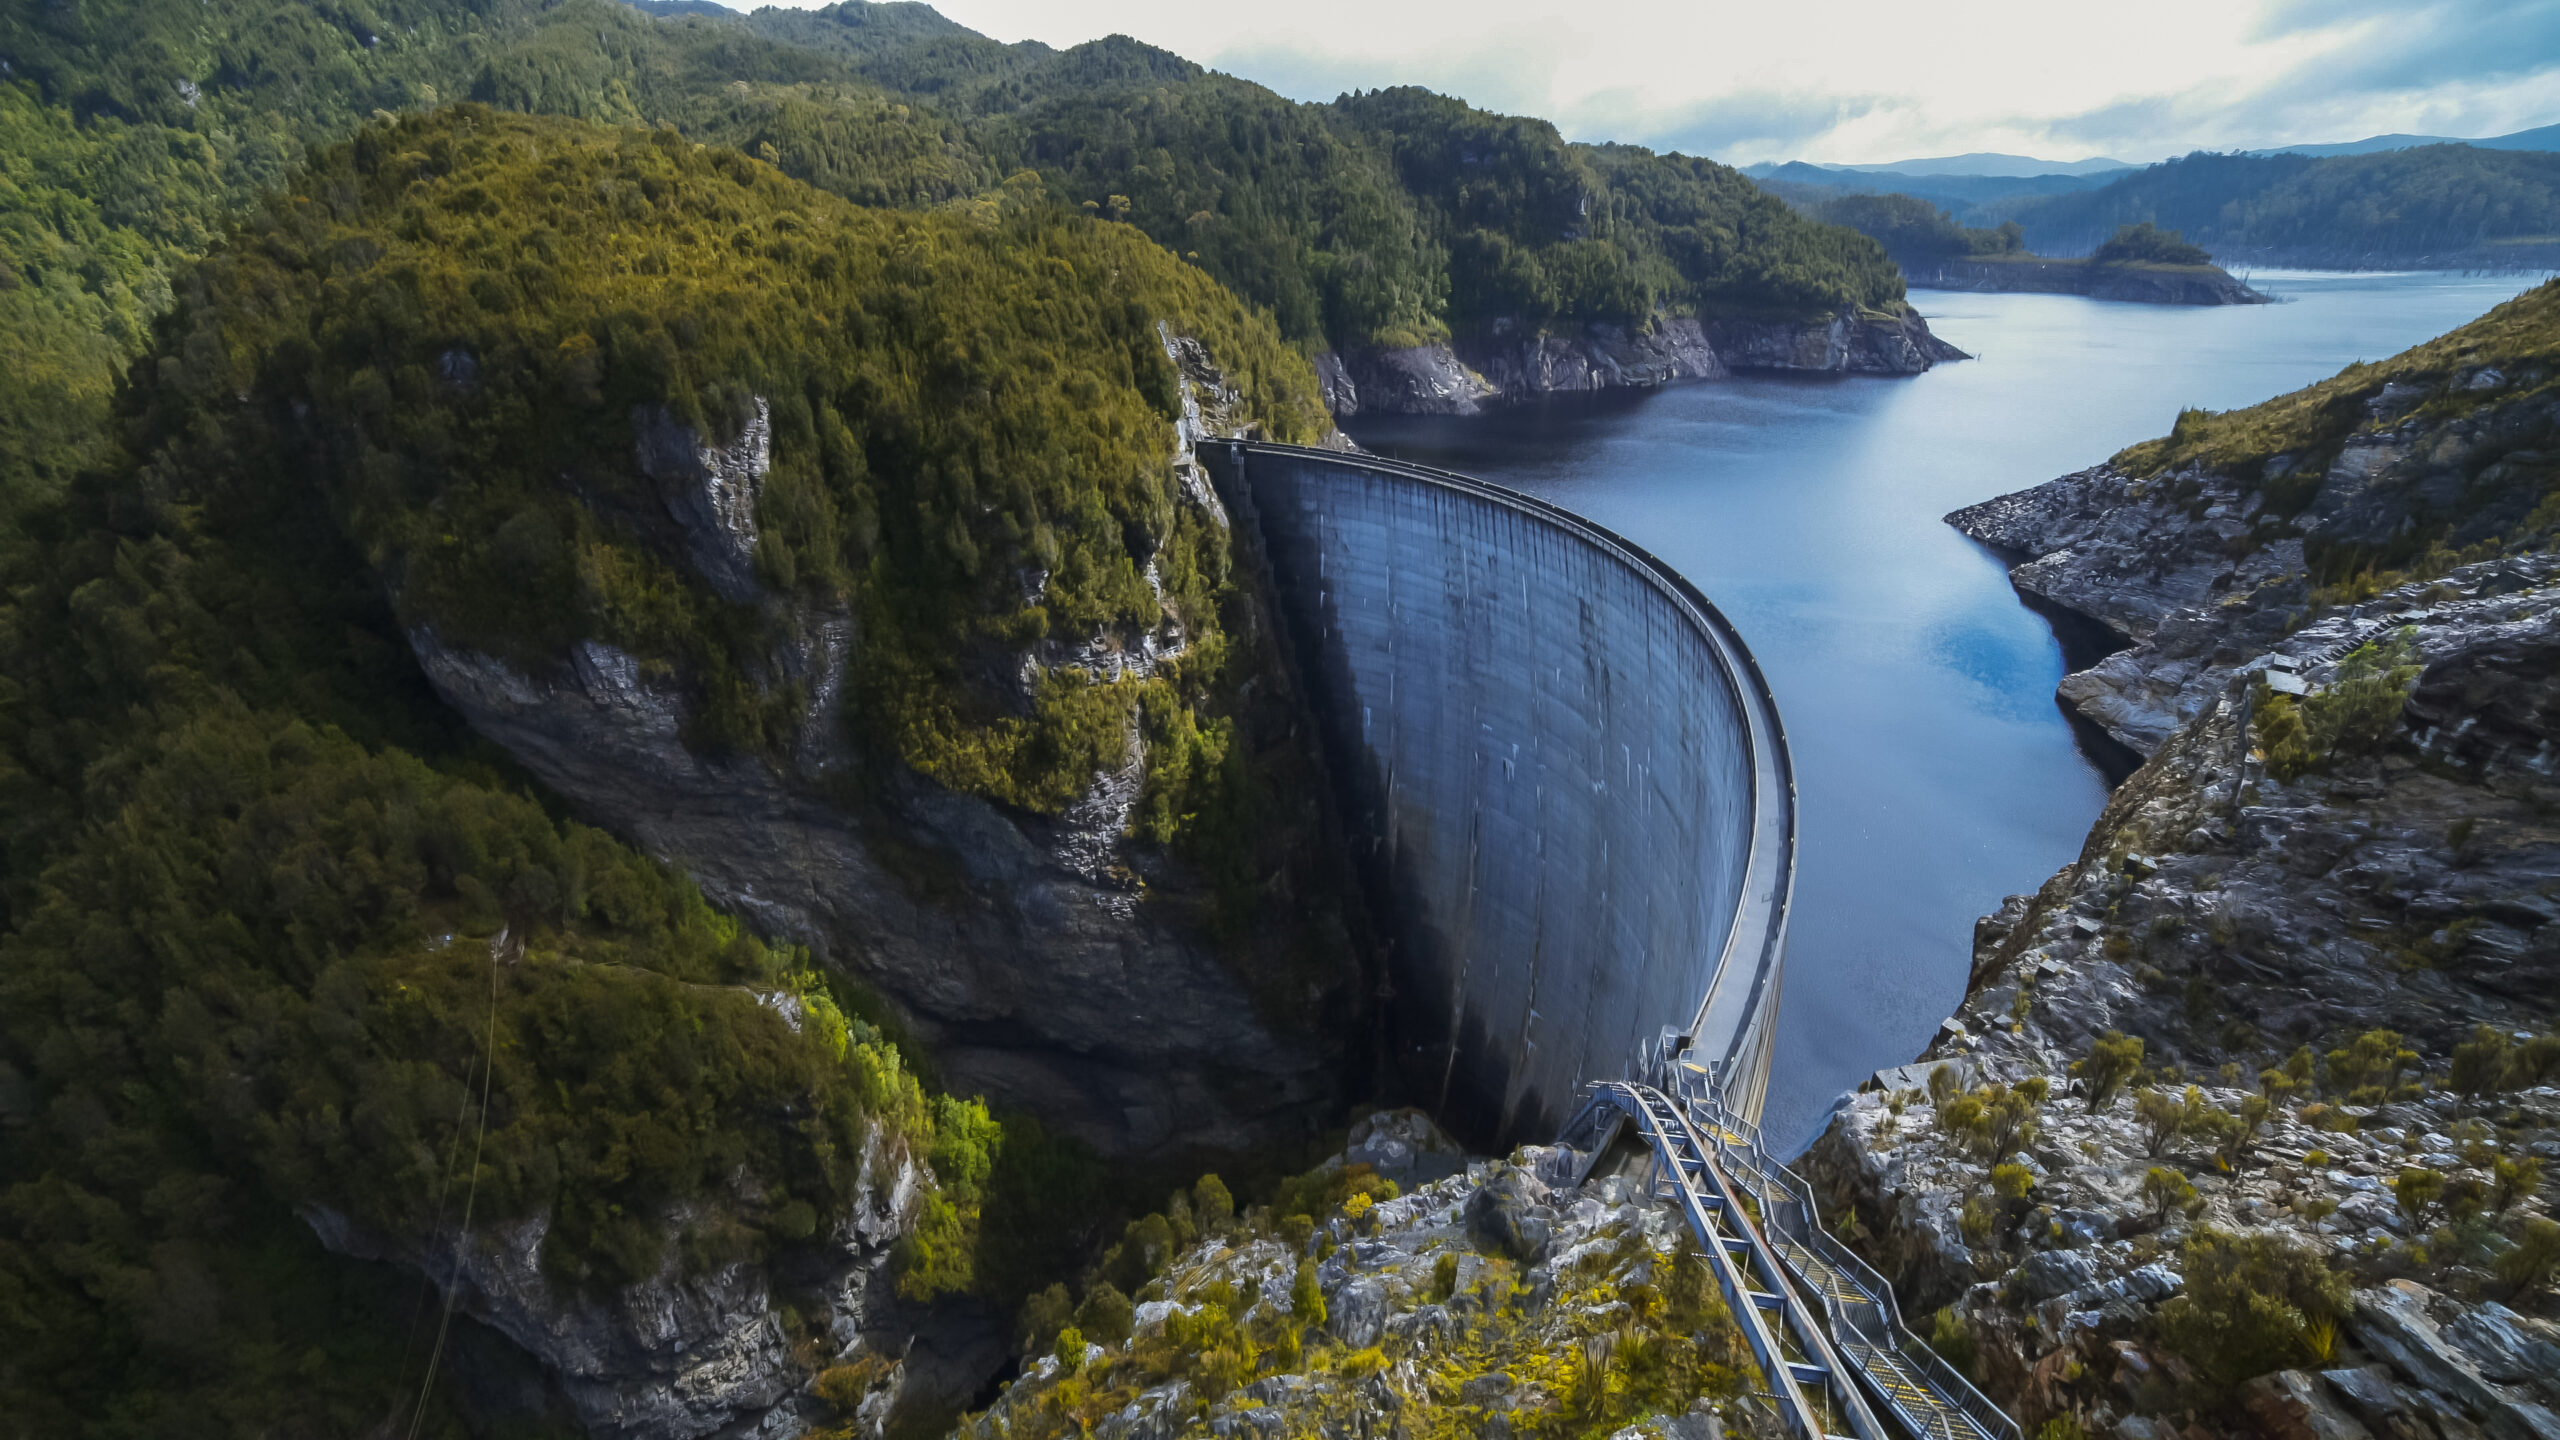
Mount Read lies within Tasmania’s hydro catchment areas which have seen well above average rainfall in July causing many dams in the northwest and west regions to spill.
What has caused the near record rainfall in July?
The Southern Annular Mode (SAM) plays a major role the position of cold fronts that move from west to east between Australia and Antartica.
When the SAM is in a negative phase, these westerly winds, and the cold fronts and low pressure systems they carry, are located further north than usual for that time of year.
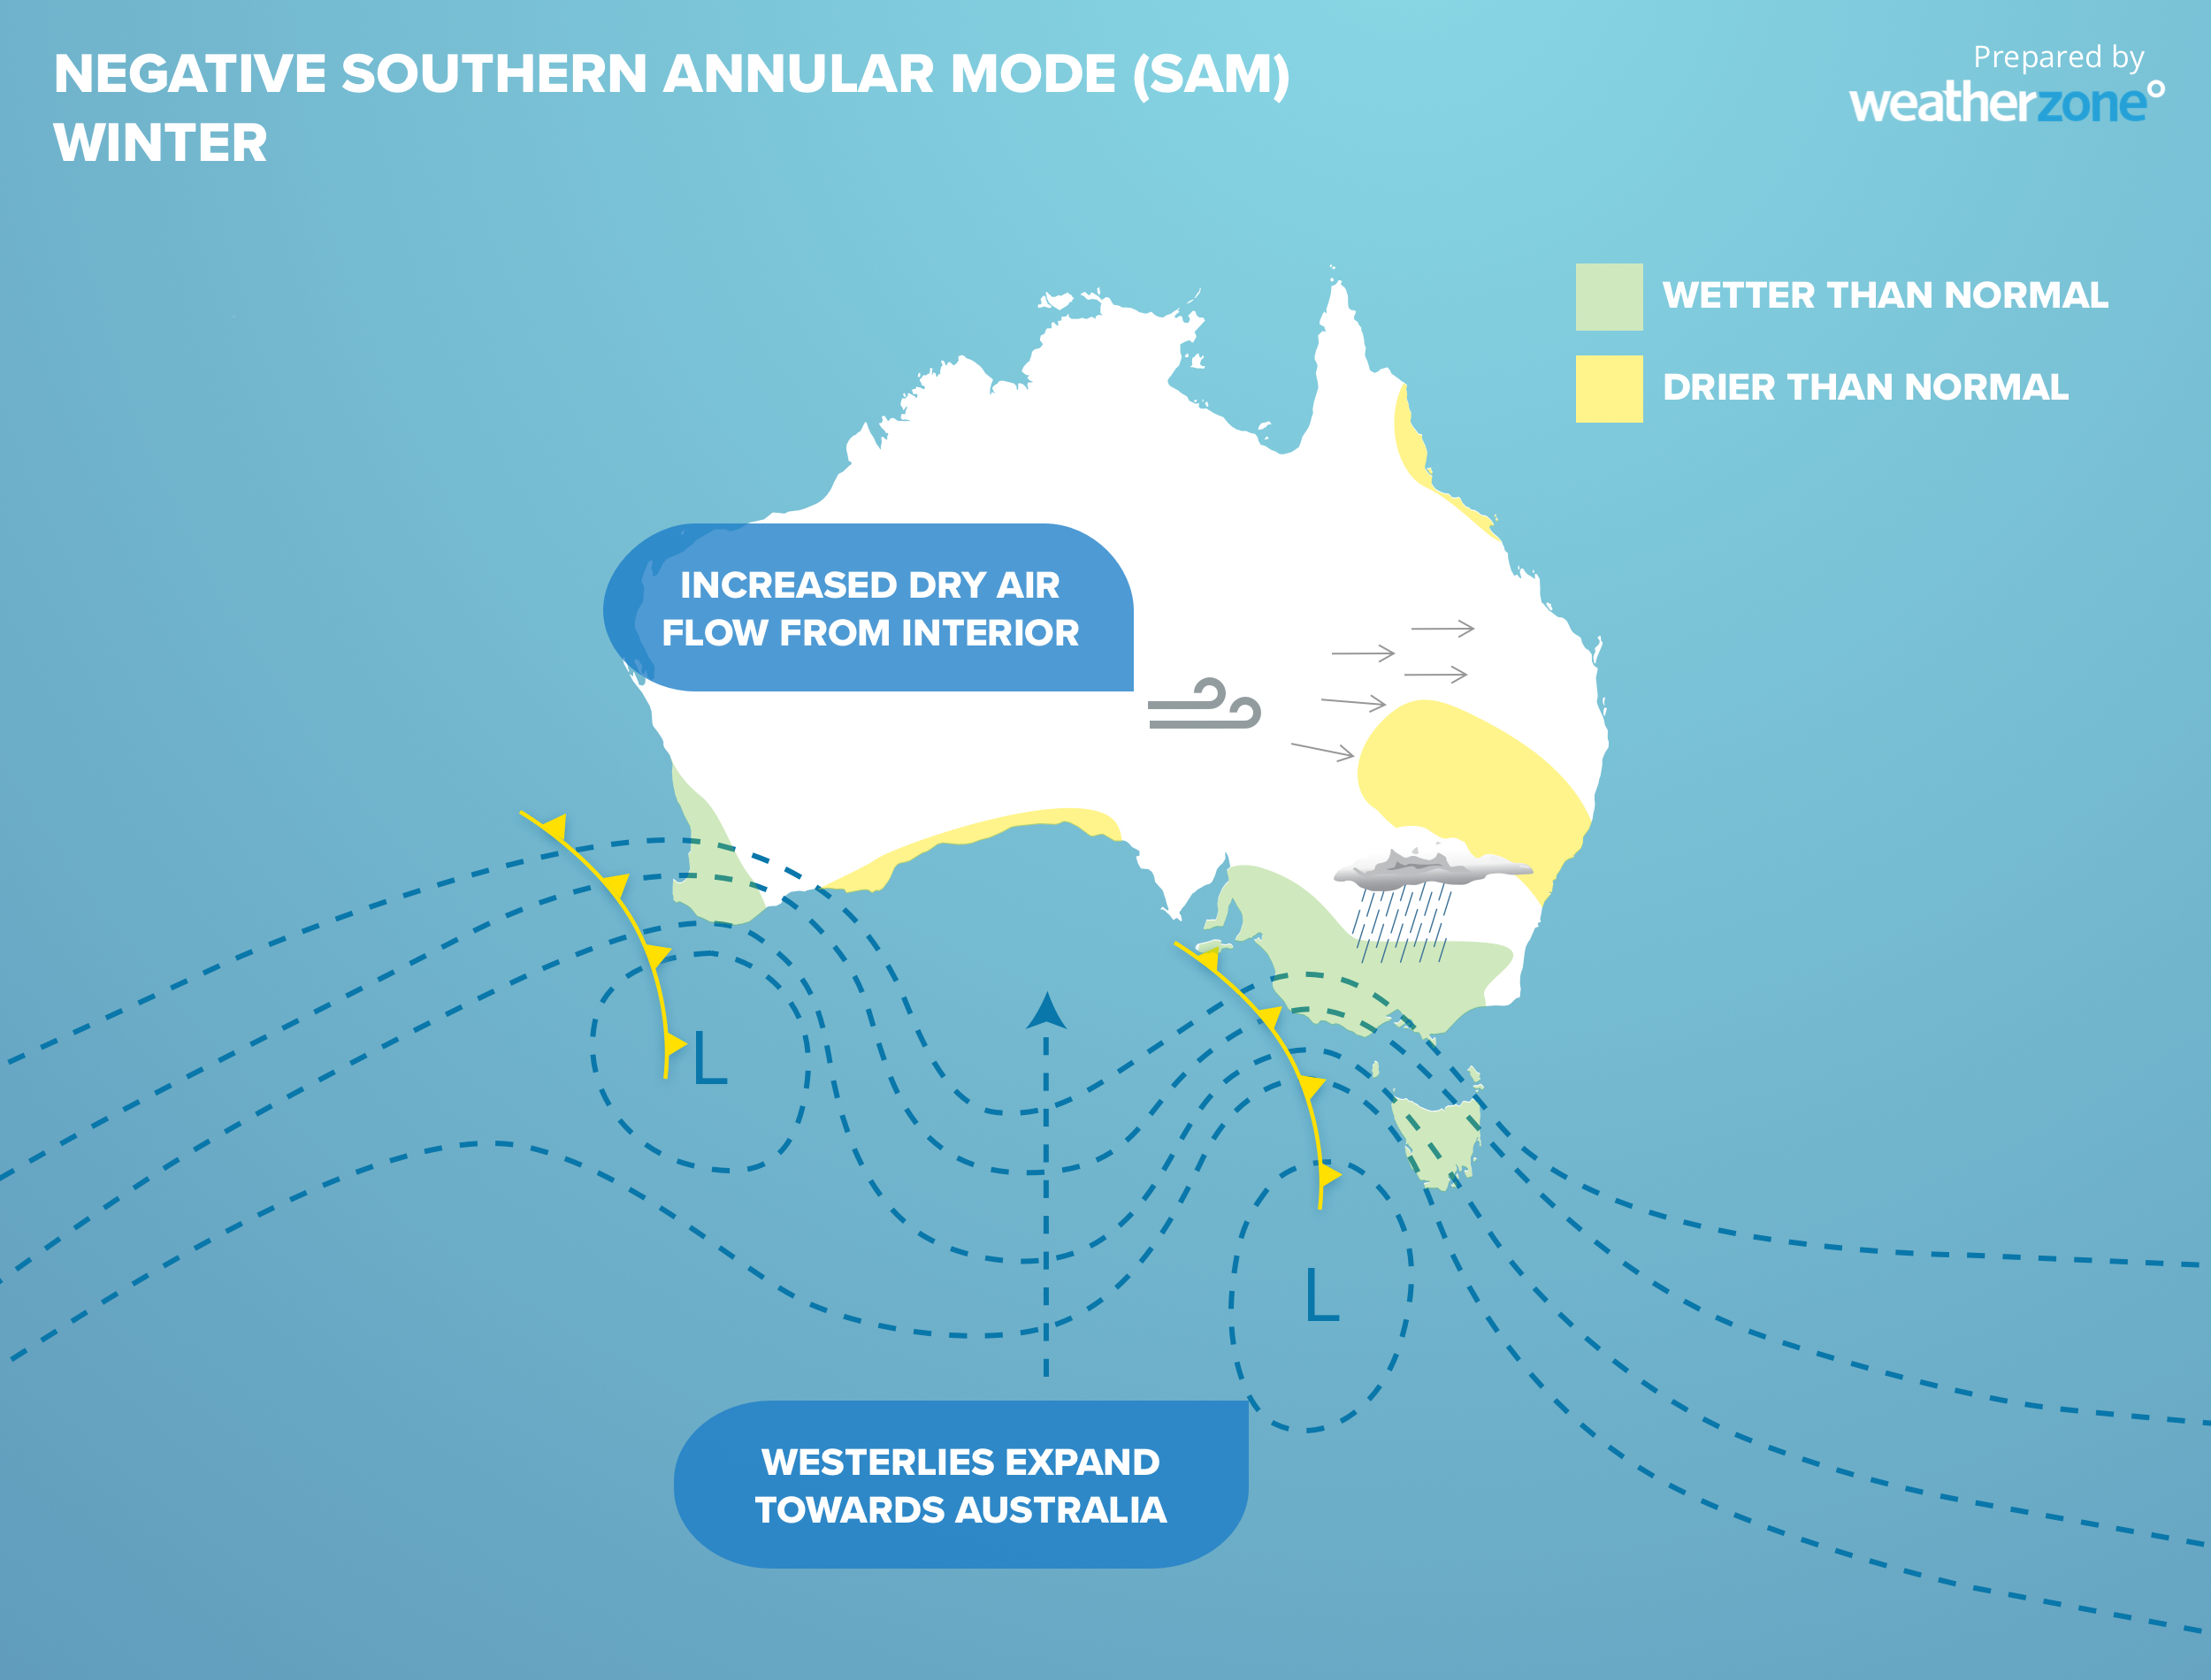 Negative phases of the SAM often increases rainfall over Tasmania, which is behind this months rainfall.
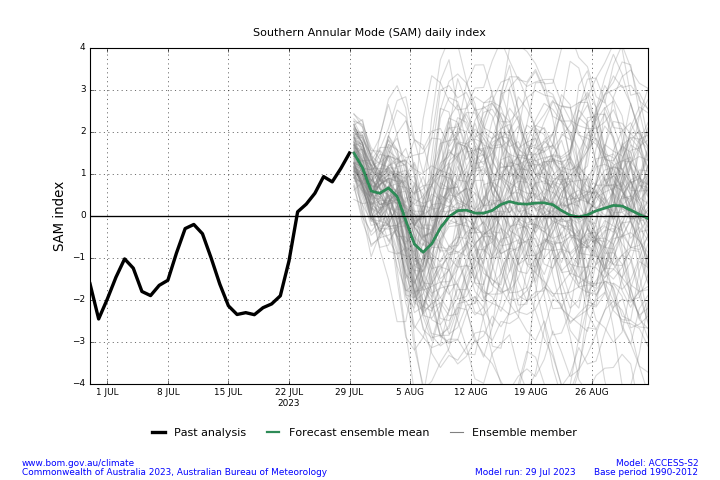
This July has had a mostly negative SAM, allowing more cold fronts to impact the coast, leading to a wet and windy month overall.
Looking ahead, Tasmania will have a few days to recover from this weekend’s wild weather before the next front (with potentially heavy rainfall forecast) comes through on Friday.
DTN APAC hydropower forecasts
Using Opticast’s nowcasting and forecasting capabilities, you will have long-term outlook covering rainfall and extreme heat events out to 12 months. This can significantly improve your planning as you integrate the data with site-specific hydrological parameters.
With renewables making up more of Australia’s energy mix every year, we want to support your business to make informed critical decisions and improve your overall generation and safety.
To find out more please visit our website or email us at apac.sales@dtn.com.


